Article

Antioxidant and Antibacterial Properties of Norway Spruce (Picea abies H. Karst.) and Eastern Hemlock (Tsuga canadensis (L.) Carrière) Cone Extracts

by
Tamás Hofmann
1,*,
Levente Albert
1,
László Németh
2,
Martina Vršanská
3,
Nikola Schlosserová
3,
Stanislava Voběrková
3 and
Eszter Visi-Rajczi
1
1
Institute of Chemistry, University of Sopron, H-9400 Sopron, Hungary
2
Institute of Mathematics, University of Sopron, H-9400 Sopron, Hungary
3
Department of Chemistry and Biochemistry, Mendel University in Brno, CZ-61300 Brno, Czech Republic
*
Author to whom correspondence should be addressed.
Forests 2021, 12(9), 1189; https://doi.org/10.3390/f12091189
Submission received: 17 June 2021 / Revised: 26 August 2021 / Accepted: 30 August 2021 / Published: 1 September 2021

Abstract

:
According to recent studies, Norway spruce cones and eastern hemlock cones possess exceptionally high antioxidant capacities; however, the antioxidant efficiency of extractives and their bioactive effects have yet to be investigated in detail. The present article utilizes state-of-the art analytical chemical methodology and chemometric evaluation to reveal cone extractives with the highest antioxidant potential, accounting for possible bioactive effects. Antioxidant properties were determined by the Ferric reducing antioxidant power (FRAP) assay and the Folin–Ciocalteu’s total phenol content (TPC) assay. Structure and relative polyphenol concentrations were determined using liquid chromatography/diode array detection/tandem mass spectrometry. The antibacterial testing was conducted using Staphylococcus aureus and Escherichia coli strains. Using correlation analysis and factor analysis, a scoring evaluation was implemented to determine and compare the antioxidant efficiency of extractives. In Norway spruce, piceatannol-O-hexoside and coumaric acid derivatives were found to be the most powerful antioxidants, while in eastern hemlock, kaempferol glycosides were the most powerful. The antibacterial test did not show any promising antimicrobial activity against E. coli, although a visible inhibitory effect on S. aureus strain was observed.

1. Introduction

The proper and efficient utilization of the byproducts of field agriculture (skin, husks, leaves, pomace, etc.) and forestry (bark, leaves, cones, etc.) are not only urged by stricter environmental and resource management issues, but are also demanded by increasing societal responsibility. Regarding forestry, about 300–400 million m3 are generated from bark biomass alone, from which only small portions are utilized for various purposes [1]. Among the various utilization possibilities, the extraction of bioactive compounds has been researched extensively in recent decades [2,3,4]. The chemical composition of bioactive compounds and other extractives in wood bark, leaves, cones, seeds and resin varies depending on the tree species and is also determined by genotypic, ecologic, seasonal, etc. factors [5,6,7,8,9,10,11,12]. The general chemical and nutritional composition of bioactive compounds has been described by several authors for bark [6,7,8], needles [9], cones [10] and seeds/nuts [11]. Antioxidants are a group of utilizable compounds [13,14] that can be used in healthcare products [15,16,17], food preservatives and ingredients [18,19,20,21], natural growth regulators [22,23], production of silver nanoparticles [24,25] and a variety of other products.
The potential bioactive effects (anti-inflammatory, antioxidant, antiseptic, antifungal, antimicrobial, analgesic, anticancer, antimutagenic, antiviral, etc.) of the extractives and essential oils of Pinus, Thuya, and Cedrus spp.a cones have been extensively researched [5,26,27,28,29,30,31,32,33,34].
In their work, Hofmann et al. [35] presented a simple, reproducible extraction and a systematic evaluation method for the complex assessment of the antioxidant capacity of various coniferous taxa involving different ripening stages of the cones. Their results were in accordance with earlier findings [36,37,38,39] where samples containing the highest antioxidant compound levels (Metasequoia glyptostroboides Hu and W. C. Cheng, Cryptomeria Japonica (L.f.) D. Don, Chamaecyparis lawsoniana (A. Murray) Parl., Thuja orientalis L.) had been shown to possess various benign effects on human health and bioactivity. According to the authors, the green cones of Norway spruce (Picea abies H. Karst.) and eastern hemlock (Tsuga Canadensis (L.)) also possessed exceptionally high antioxidant capacity; however, no literature data on the polyphenolic composition or the bioactivity of the cones of these two taxa was found. The ecological, industrial, and economic significance of the two taxa also demand a more detailed research study on the utilization of the cone byproducts. Norway spruce is one of the most common coniferous species in Europe with an undoubted ecological and economic significance [40,41], while eastern hemlock is a foundation species in forests of eastern North America [42] and has a wide natural range [43].
A later study by the authors on the polyphenolic composition of these cones has tentatively identified 82 compounds, including flavonoid-O-glycosides, chlorogenic acid isomers, coumaric acid derivatives, flavonoid glycosides, stilbenoids, as well as flavan-3-ol compounds, which is a first-time discovery [44].
The present study aims to investigate the polyphenolic composition of Norway spruce and eastern hemlock green cone extracts and to use chemometric evaluation to determine which of the extractives account primarily for the antioxidant properties. Extraction was achieved using various compositions of aqueous acetone solutions. Antioxidant properties were assayed by the Folin–Ciocâlteu total polyphenol content (TPC) and ferric reducing antioxidant power (FRAP) methods. The polyphenol structure, profile and relative concentrations were investigated using high-performance liquid chromatography/diode array detection/multistage electrospray mass spectrometry (HPLC-PDA-ESI-MS/MS). The antibacterial test of green and mature cone extracts was run on Staphylococcus aureus and Escherichia coli bacterial strains, using three antimicrobial assays: disc diffusion test (DDT), minimal inhibitory concentration (MIC) and MIC with following growth curves.
The results of the present study could contribute to future extraction optimization of the cones and to the identification of the compounds responsible for bioactive effects.

2. Materials and Methods

2.1. Chemicals and Reagents

Water for the analyses was prepared by double distillation using conventional distillation equipment. LCMS-grade acetonitrile, as well as acetone, was obtained from VWR International (Budapest, Hungary). Ascorbic acid, gallic acid, iron(III)-chloride, acetic acid, sodium acetate, 2,4,6-tripyridyl-S-triazine (TPTZ), sodium carbonate, hydrochloric acid, Columbia blood agar and dimethyl sulfoxide were purchased from Sigma-Aldrich (Budapest, Hungary), while Folin–Ciocâlteu reagent was obtained from Merck (Darmstadt, Germany).

2.2. Sample Collection and Extraction

Sample collection occurred at the Botanical Garden of the University of Sopron in Sopron, Hungary in 2019. Cones were harvested from one healthy individual of each taxon by collecting 50 (eastern hemlock) or 10 (Norway spruce) cones from different parts of the crown. Sample collection was carried out at two ripening stages: green cones were harvested in July when cones reached their full size, yet were still green in color, while mature cones were collected in August when cones have ripened, browned, and began to open their scales. Samples were stored at −20 °C until processing. Just before extraction, cone samples were thawed, chopped up into small pieces and ground using a conventional household coffee grinder. Because the obtained plant material was wet, no sieving was carried out. Ultrasonic extraction was performed using an Elma Transsonic T570 ultrasonic bath (Elma Schmidbauer GmbH, Singen, Germany) as follows: 0.45 g ground sample was homogenized with different compositions (0–100% acetone in 10% increments) of 45 mL aqueous acetone solution in a 50 mL centrifuge tube and sonicated for 3 × 10 min as described by Hofmann et al. (2020) [35].

2.3. Determination of Antioxidant Properties

The TPC and FRAP assays were run in triplicates using a Hitachi U-1500 type spectrophotometer (Hitachi Ltd., Tokyo, Japan). The TPC was determined by applying the Folin-Ciocâlteu assay [45] using gallic acid as the standard as follows: 0.5 mL extract solution (extract) was mixed with 2.5 mL 10-fold diluted Folin-Ciocâlteu reagent. Subsequently, 2 mL 0.7 M Na2CO3 solution was added, and the mixture was placed into a 50 °C water bath for 5 min. A cold water bath was used to stop the reaction and cool to room temperature. The absorbance of the reaction mixture was measured at 760 nm; results were expressed as mg equivalents of gallic acid/g dry cone units (mg GAE/g dw.). The FRAP method described by Benzie and Strain [46] was applied for the measurement of the FRAP antioxidant capacity at 593 nm using ascorbic acid as a standard after 5 min reaction time. Results were given in mg equivalents of ascorbic acid/g dry cone (mg AAE/g dw.).

2.4. HPLC-PDA-ESI-MS/MS Analyses

Separation, identification and relative quantitative determination of polyphenolic compounds were achieved using a Shimadzu LC-20 type high-performance liquid chromatograph coupled with a Shimadzu SPD-M20A type diode array detector (PDA) (Shimadzu Corporation, Kyoto, Japan) and an AB Sciex 3200 QTrap triple quadrupole/linear ion trap mass spectrometric (MS) detector (AB Sciex, Framingham, MA, USA). Conditions of the separation and compound identification process were described in detail by the authors in an earlier work [44]. The PDA detector signal (250–380 nm) was recorded and the relative concentration of each identified compound was determined by the integration of peak areas. Chromatographic data were acquired and evaluated using the Analyst 1.6.3 software (AB Sciex, Framingham, MA, USA).

2.5. Antibacterial Activity Testing

Extracts for antibacterial testing were prepared as follows: ground and thawed plant material (1 g) was extracted using 45 mL 50:50 acetone:water v/v mixture in a 50 mL centrifuge tube by sonication as described in Section 2.2 The extraction process was repeated twice for each sample and the two solutions were combined and filtered. Solutions were evaporated to dryness under reduced pressure and mild heating. The obtained dry extract powder (65–160 mg) was collected and stored at −20 °C until further investigations. Extracts (EHGC—eastern hemlock green cones, EHMC—eastern hemlock mature cones, NSGC—Norway spruce green cones, NSMC—Norway spruce mature cones) were dissolved in 1% dimethyl sulfoxide (DMSO) with a final concentration of solution 1 mg/mL. The 1% DMSO solution was used as a blank probe.
The following bacterial strains were used to determine the antibacterial activity: Gram-positive Staphylococcus aureus (CCM 4223) and Gram-negative Escherichia coli (CCM 3954). Both strains were obtained from a Czech collection of microorganisms (Brno, Czech Republic). The bacteria were cultivated for 24 h at 37 °C on 5% Columbia blood agar. The samples were run in duplicate for the disc diffusion test and in triplicate for the testing of minimal inhibitory concentration and growth rates.

2.5.1. Disc Diffusion Test (DDT)

The qualitative antimicrobial effect of extracts (1 mg/mL) was monitored by DDT [47]. The bacterial inoculum was prepared from a suspension of 0.5 Mc Farland density in Mili-Q water and used for further testing. The antibiotic amoxicillin was used as a positive control for Escherichia coli and the antibiotic penicillin for Staphylococcus aureus. The inoculated plates were incubated at 37 °C for 12 h.

2.5.2. Minimal Inhibitory Concentration (MIC)

To determinate the MIC [48] of cone extracts on selected bacterial strains, 96-well microtiter plates were used, using a two-fold Mueller Hinton broth to obtain inoculum suspension of 0.5 Mc Farland density followed by a 100-times dilution to cell density 1-2-times 106 CFU/mL. The extracts were diluted in Mili-Q water to obtain selected concentrations (0.016–1.000 mg/mL) with 100 µL of bacterial inoculum dispensed in each well of the microplate. The absorbance at 620 nm was measured at time zero, then after 15 h. Inoculum with samples was cultivated at 37 °C on plate shaker at 120 rpm. Besides MIC, the results were also evaluated as IC50 value (mg/mL), which is the extract concentration that causes 50% growth inhibition of tested bacteria.

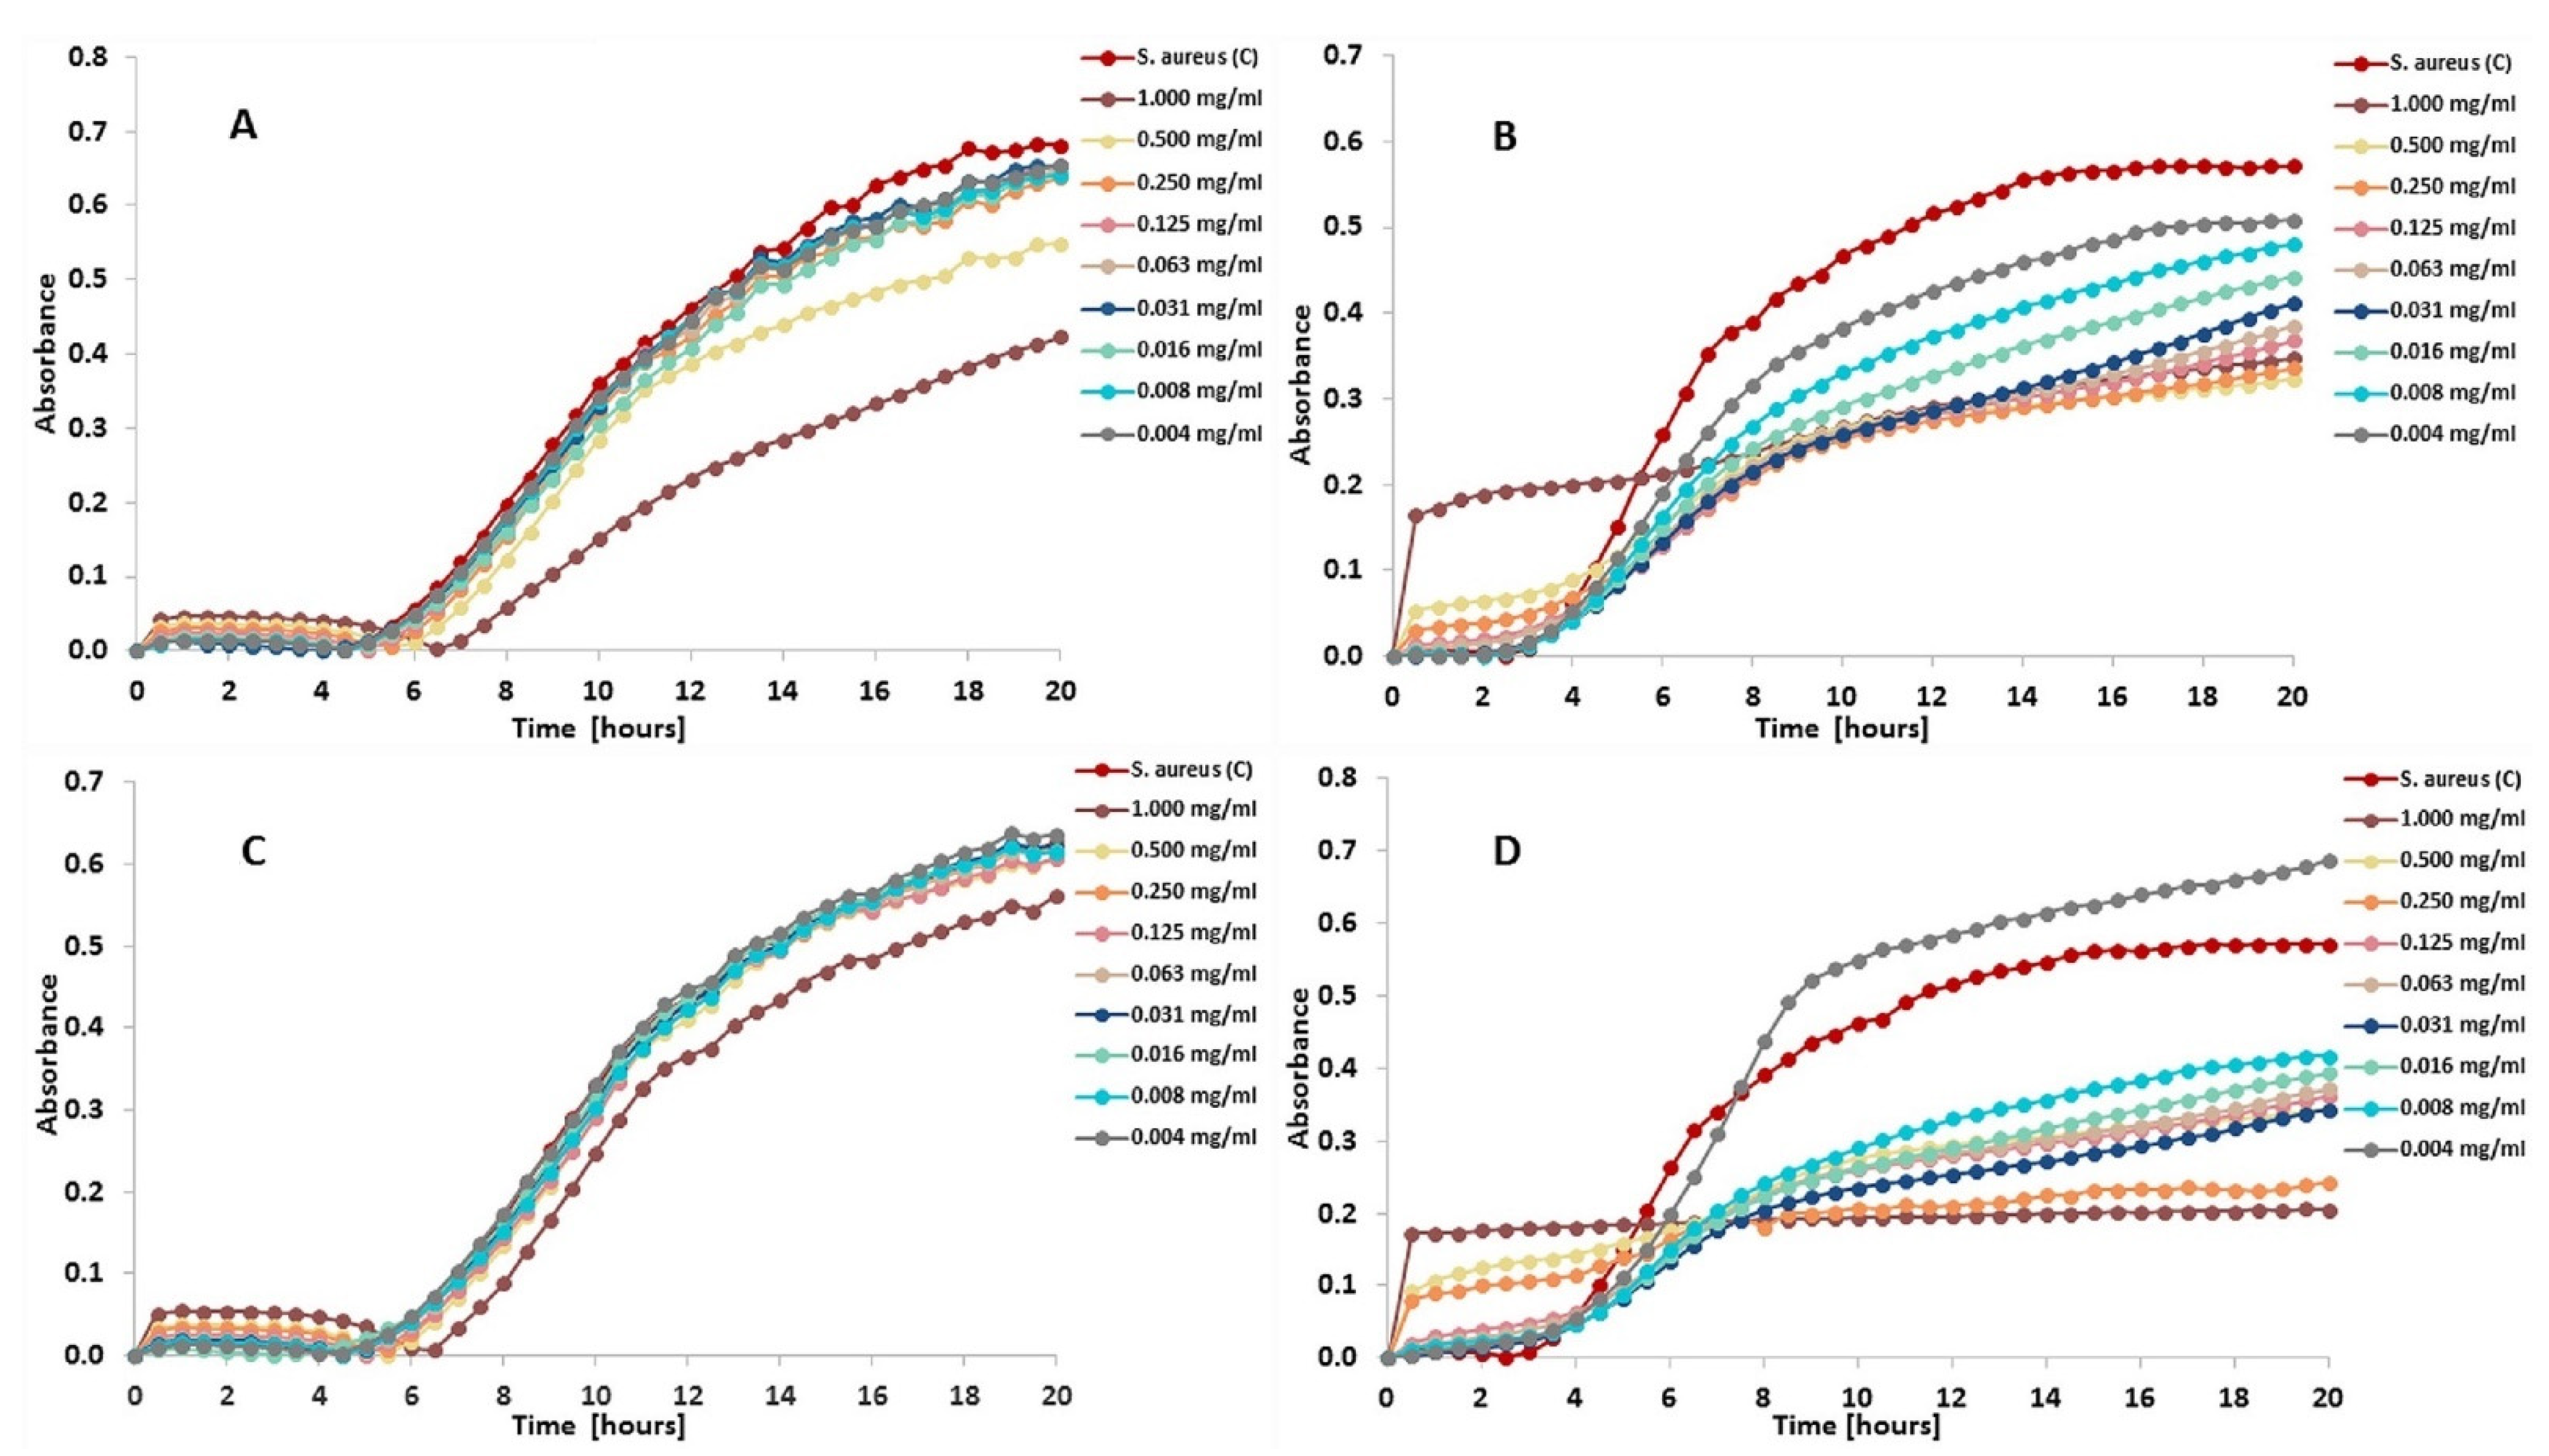
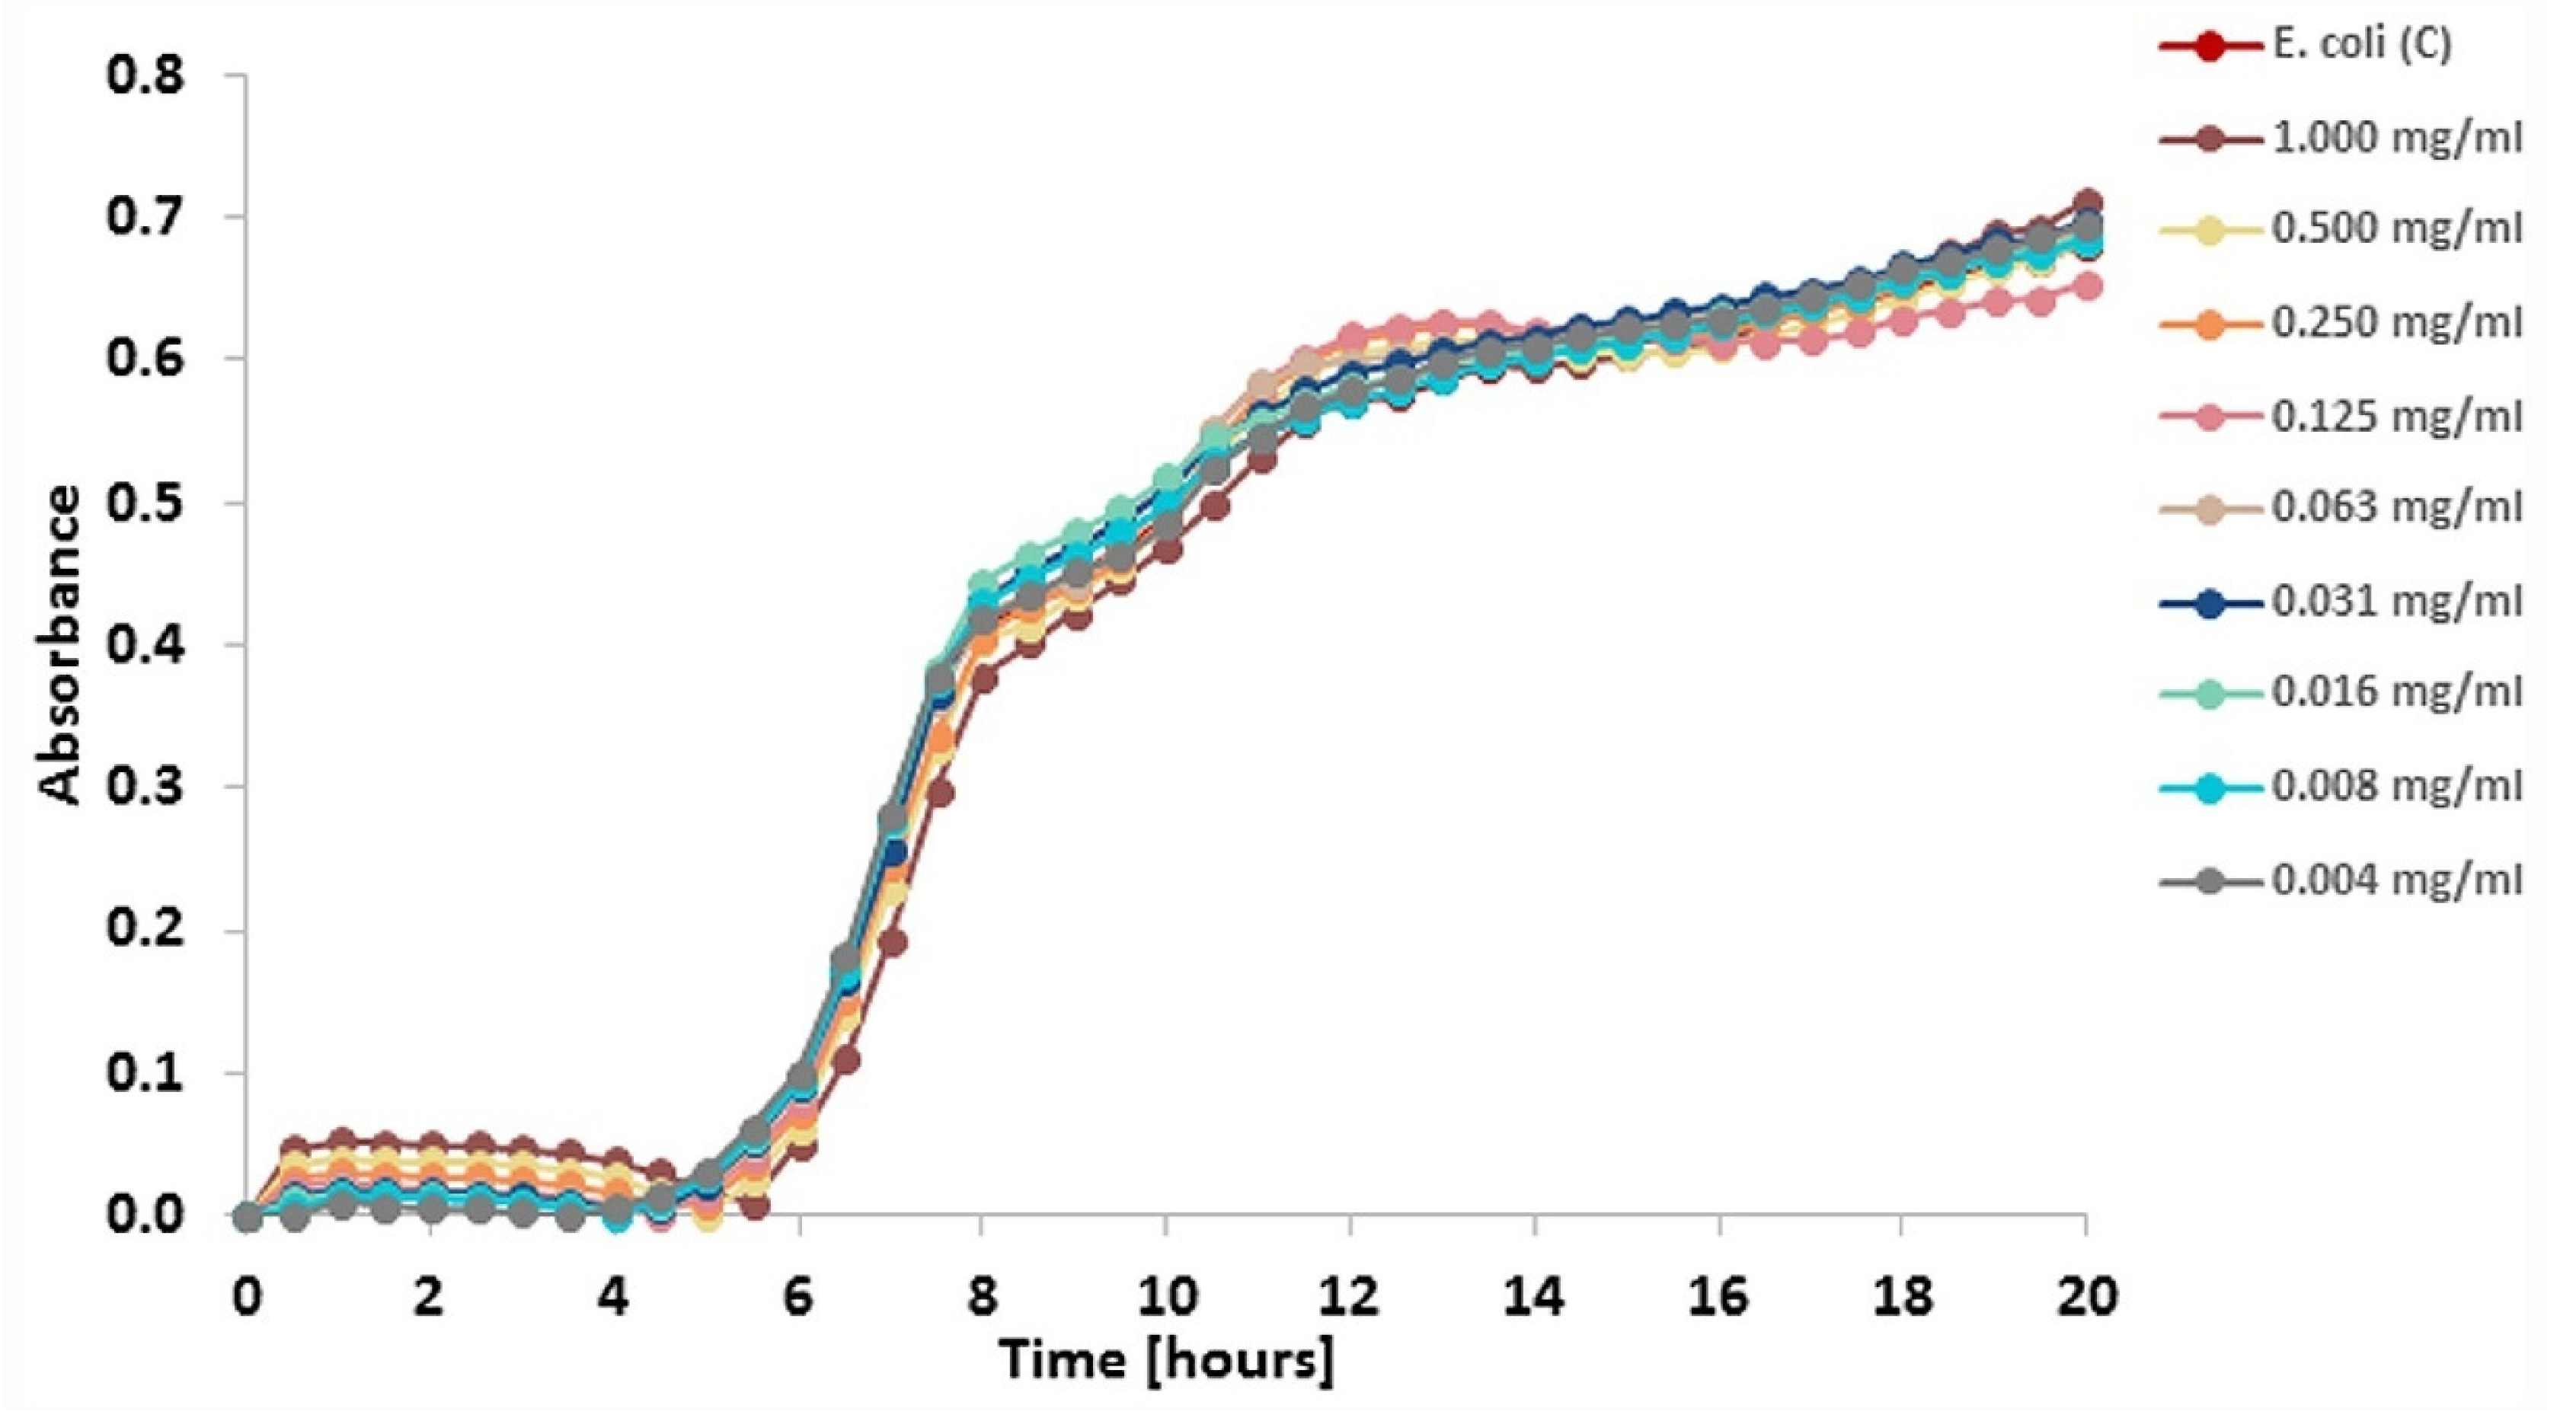
2.5.3. Effect of Cone Extracts on Bacterial Growth Rate

The bacterial growth rate with the tested extracts was determined using the broth dilution method with 100-wells microtiter plates. The same extract preparation procedure as the one for the MIC assay with concentration range from 0.004–1.000 mg/mL was applied. The growth rate of bacteria was measured by Bioscreen C MBR (Dynex, Czech Republic). The absorbance (620 nm) was monitored at time zero, and then at 30 min intervals at 37 °C for 20 h.

2.6. Statistics and Scoring Evaluation

Correlation analysis and factor analysis was run using Statistica 11 software (StatSoft Inc., Tulsa, OK, USA).

3. Results and Discussion

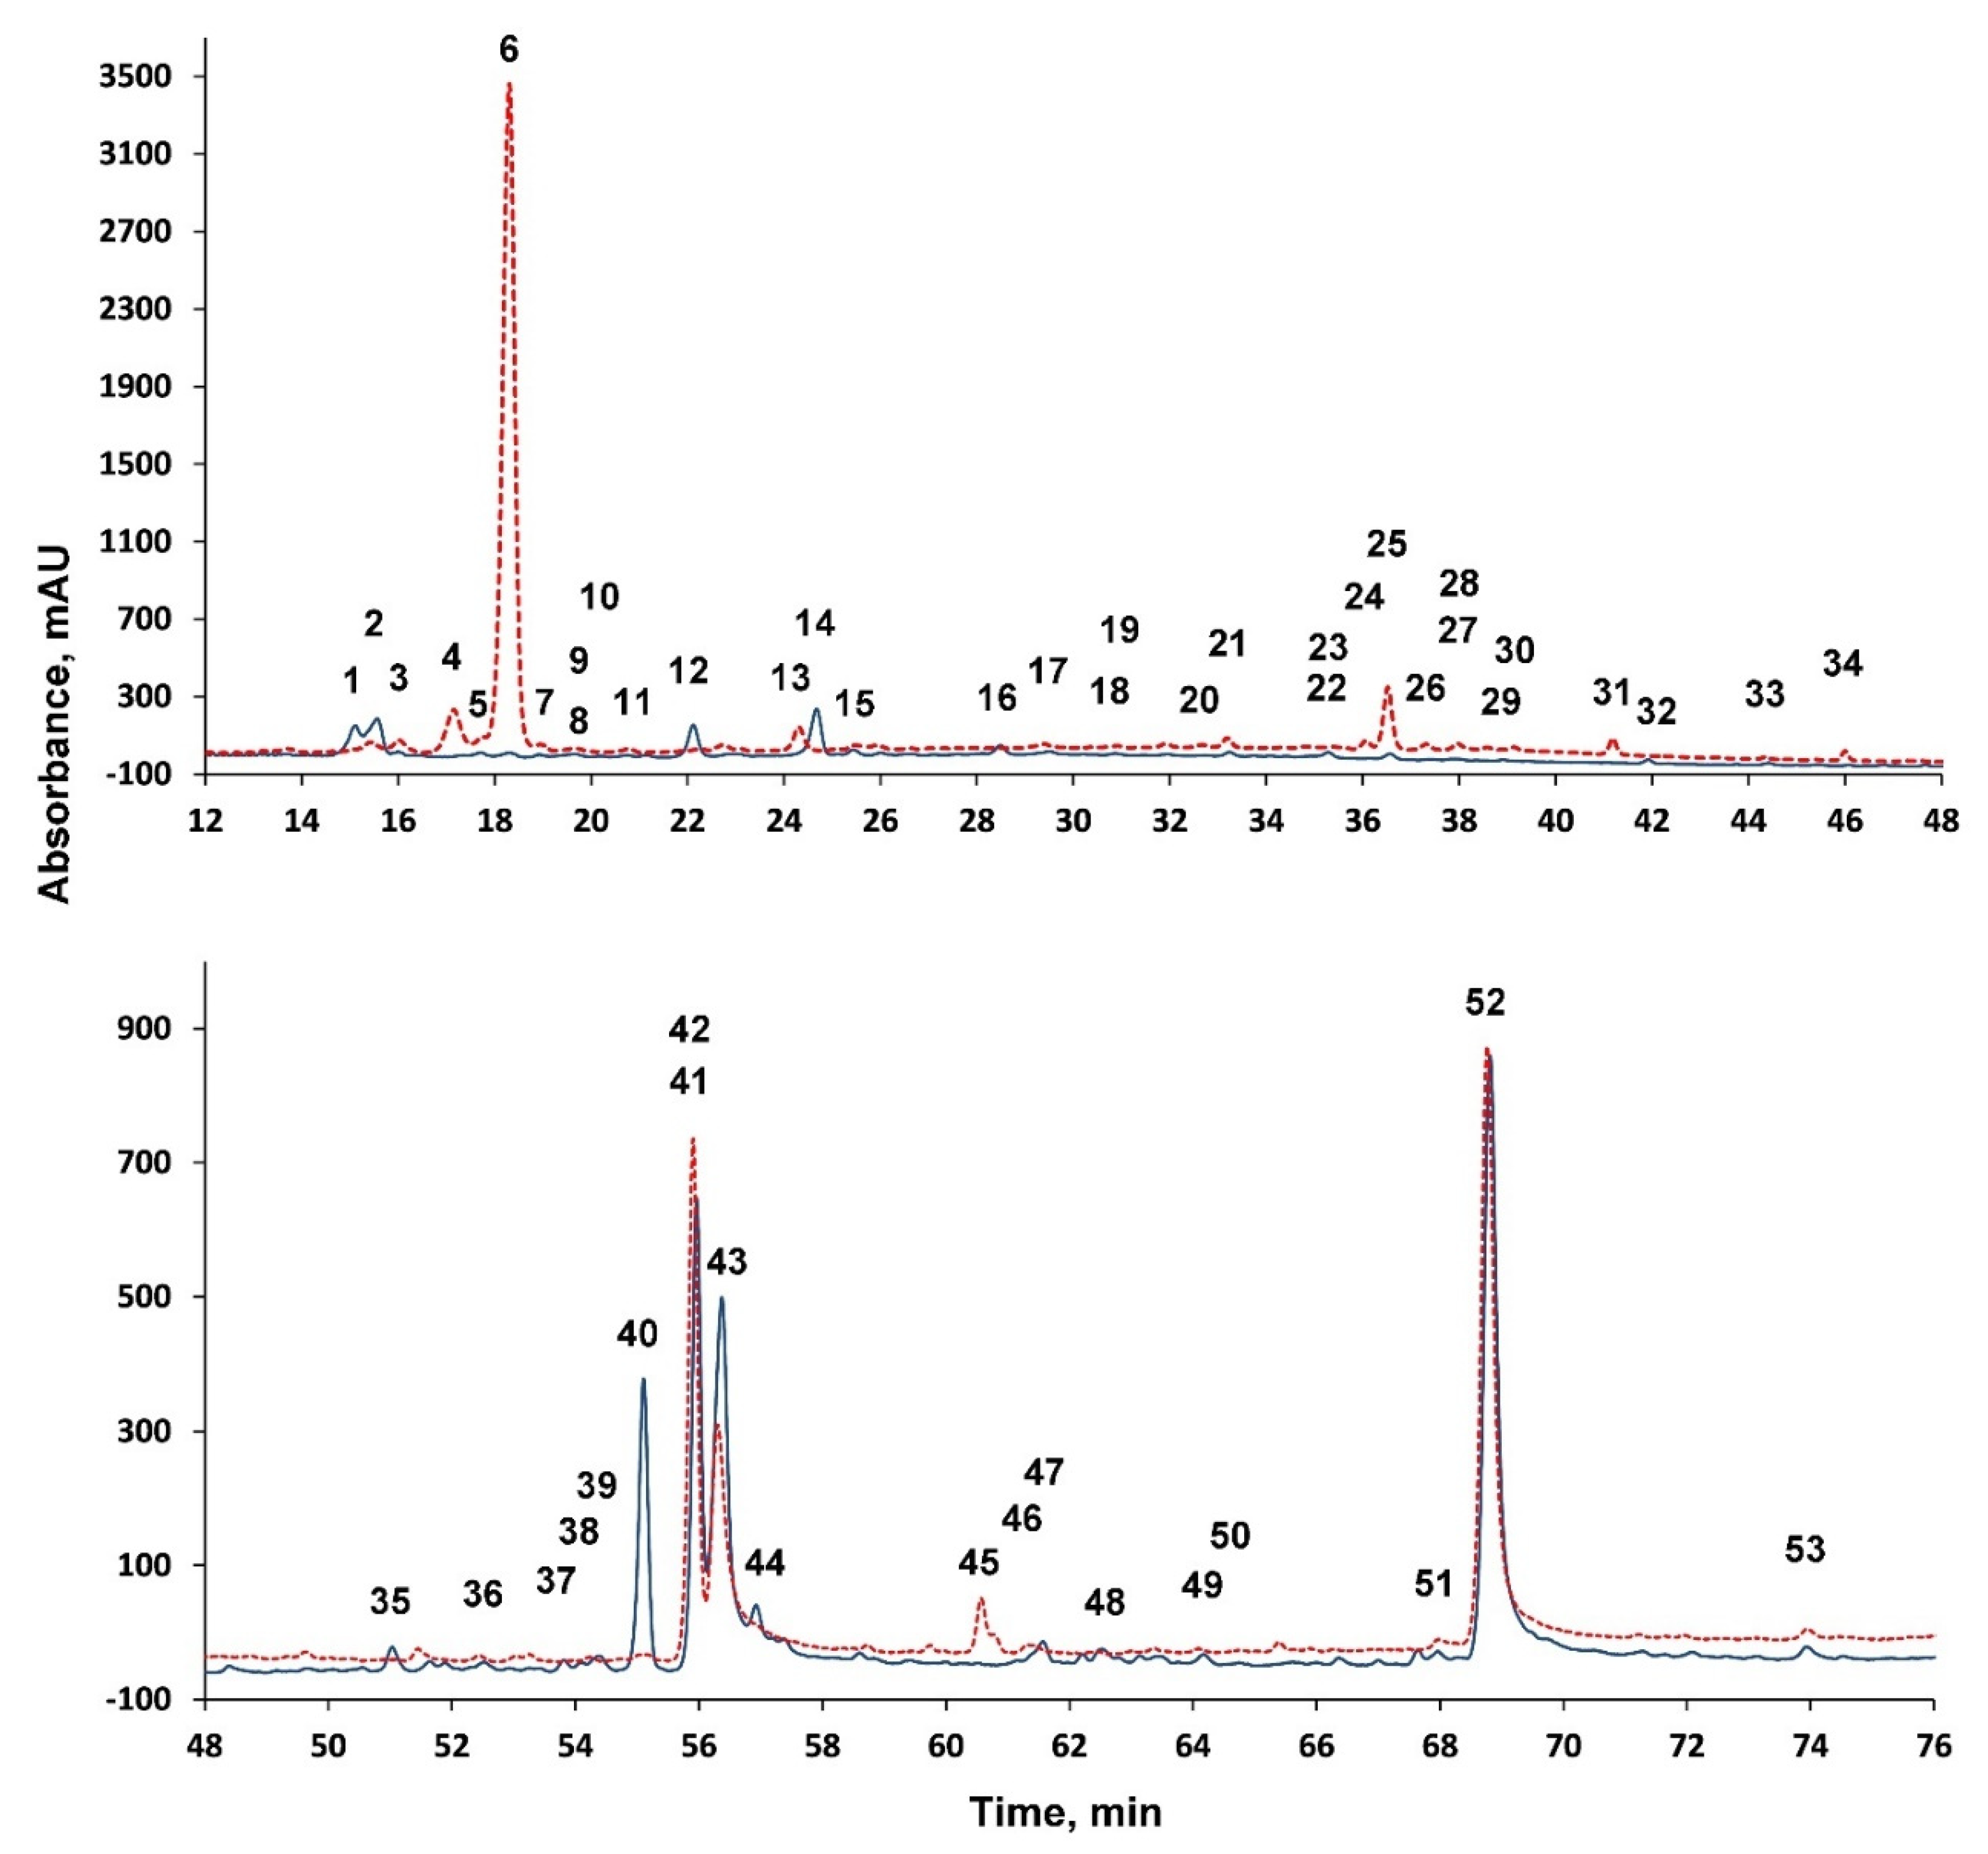
3.1. Identification of Cone Extractives

Previous studies on the polyphenol composition of the cones of the two taxa revealed that they contained a large number (82) of polyphenolic compounds, including kaempferol-, quercetin, isorhamnetin-O-glycosides, chlorogenic acid isomers, coumaric acid derivatives, piceatannol and its conjugates, as well as flavan-3-ol compounds [44]. From the identified compounds, the present study investigated only those that had a significant and measurable peak area in the UV chromatogram, and which ostensibly contribute to the antioxidant effects. The investigation was conducted using only green cones because earlier studies indicated that these have superior antioxidant capacity compared to mature cones [44].
The current study examined 30 compounds from Norway spruce polyphenols and 32 compounds from eastern hemlock polyphenols; some of the compounds were evidenced in both taxa (Table 1). Compounds were identified using the MS/MS fragmentation pattern (mass spectra) and previous studies [44]. Although mass spectrometric data were evaluated using the literature and mass spectrometric databases, some of the compounds that gave significant peaks in the UV chromatogram were left unidentified because they either gave no ionization or the mass spectrum could not be interpreted. Despite the lack of structural information, these unidentified compounds may have a significant role in determining antioxidant properties of the extracts, thus were included in the evaluation.
Figure 1 depicts typical chromatograms of the cone extracts of the two taxa. The peaks represent individual compounds, and the peak area is proportional to the concentration of compounds. The present study completed a relative quantitative assessment of the compounds because determining absolute concentrations would have been infeasible due to the lack of appropriate analytical standards for most of the compounds. Relative quantification assumes that peak areas are proportional to concentrations; thus, the concentrations of a given compound can be compared between different sample chromatograms. The wavelength range of 250–380 nm was chosen because this setting gave the highest peaks in the chromatograms and this range includes the absorbance range of polyphenols in is general.

3.2. Norway Spruce Samples Evaluation

The peak areas as well as the FRAP and TPC antioxidant capacities of the cone extracts of Norway spruce are included in Supplementary Table S1. The highest FRAP values were experienced in the 30:70 acetone:water v/v solution (225. 6 mg AAE/g dw.), while TPC was the highest in the 60:40 acetone:water extraction mixture (67.1 mg GAE/g dw.). The results also prove the selective manner of antioxidant assays, more specifically, that different assays are differently selective to given compounds. Thus, multiple assays should be run to determine the overall antioxidant power of complex plant extracts [49,50]. Apparently, the compounds followed different trends depending on their polarity and water solubility: catechins, and other flavan-3-ols (procyanidins), had the highest levels in the 10–20% v/v acetone extracts, flavonoid glycosides were best soluble in 30–50% v/v acetone solutions, while derivatives of phenolic acids and stilbenes had the highest levels in 50–60% v/v acetone extracts. The different selectivity of solvent systems and compositions on the extraction efficiency of polyphenols has already been researched [51,52]; thus, depending on the sample, an appropriate solvent composition should be chosen.

3.2.1. Correlation Evaluation

The easiest way to discover the connection between the concentration of individual polyphenols and antioxidant capacity is to establish linear correlations. It was supposed that if the correlation between the concentration of an individual compound and an antioxidant capacity assay (FRAP or TPC) is significant and has a high positive value, then this compound influences the antioxidant property of the extract, thus contributeing potentially to the antioxidant and other beneficial effects of the cone extracts. The “strength” of linear correlations was determined using Pearson’s correlation coefficient (R) value. It was assumed that if the correlation was significant (ǀRǀ ≥ 0.60 for n = 11 and p < 0.05), then the given compound significantly contributes to the antioxidant power of the plant extract [42]. A score which equaled the R value was assigned for measuring this contribution of a compound to the antioxidant capacity. The correlation analysis was run for FRAP and TPC; scores were summarized compound-wise (Table 2).
According to Table 2, only positive significant correlations were established, indicating that the antioxidant power increases with the increase in concentration. The compounds with the highest scores were piceatannol-O-hexoside, coumaric acid derivatives 1–4 and 7, as well as unidentified compound 2 and the ferulic acid derivative. While most of the coumaric acid derivatives had high scores, flavonoid glycosides, catechins and other falvan-3-ols achieved medium to low scores. Although catechins and procyanidins are strong antioxidants, and abundant in different parts of forest trees [49,53,54] and other plants, in Norway spruce cones they seem to have a lesser role. The same applies to the flavonoid glycoside compounds.
Piceatannol-O-hexoside (astringin) is the hexose conjugate of piceatannol (astringinin), a known compound in the bark [55] and needles [56] of Norway spruce, and other Picea species [57,58] as well as in grapevine [59] and wine [60]. The technological and scientific importance of piceatannol-O-hexoside and aglycone piceatannol is justified by recent studies, proving their role in the defense reactions and stress responses in living trees [61] and plants [62] as well as their antifungal and other related bioactive effects [60,61,62,63]. The beneficial effects of these compounds on human health have been also researched extensively [60,64].
The antioxidant, antimicrobial, antitumor, anti-inflammatory, antiplatelet aggregation and other health benefits of coumaric acid and its conjugates have already been reviewed in the literature [65,66]. Moreover, these compounds are especially important for a cosmeceutical use also due to their depigmenting potential and anti-collagenase activity [67].
Although Unidentified 2 yielded no ions in the ion source during mass spectrometric identification because of its significance revealed in the correlation test, its structure needs further research.

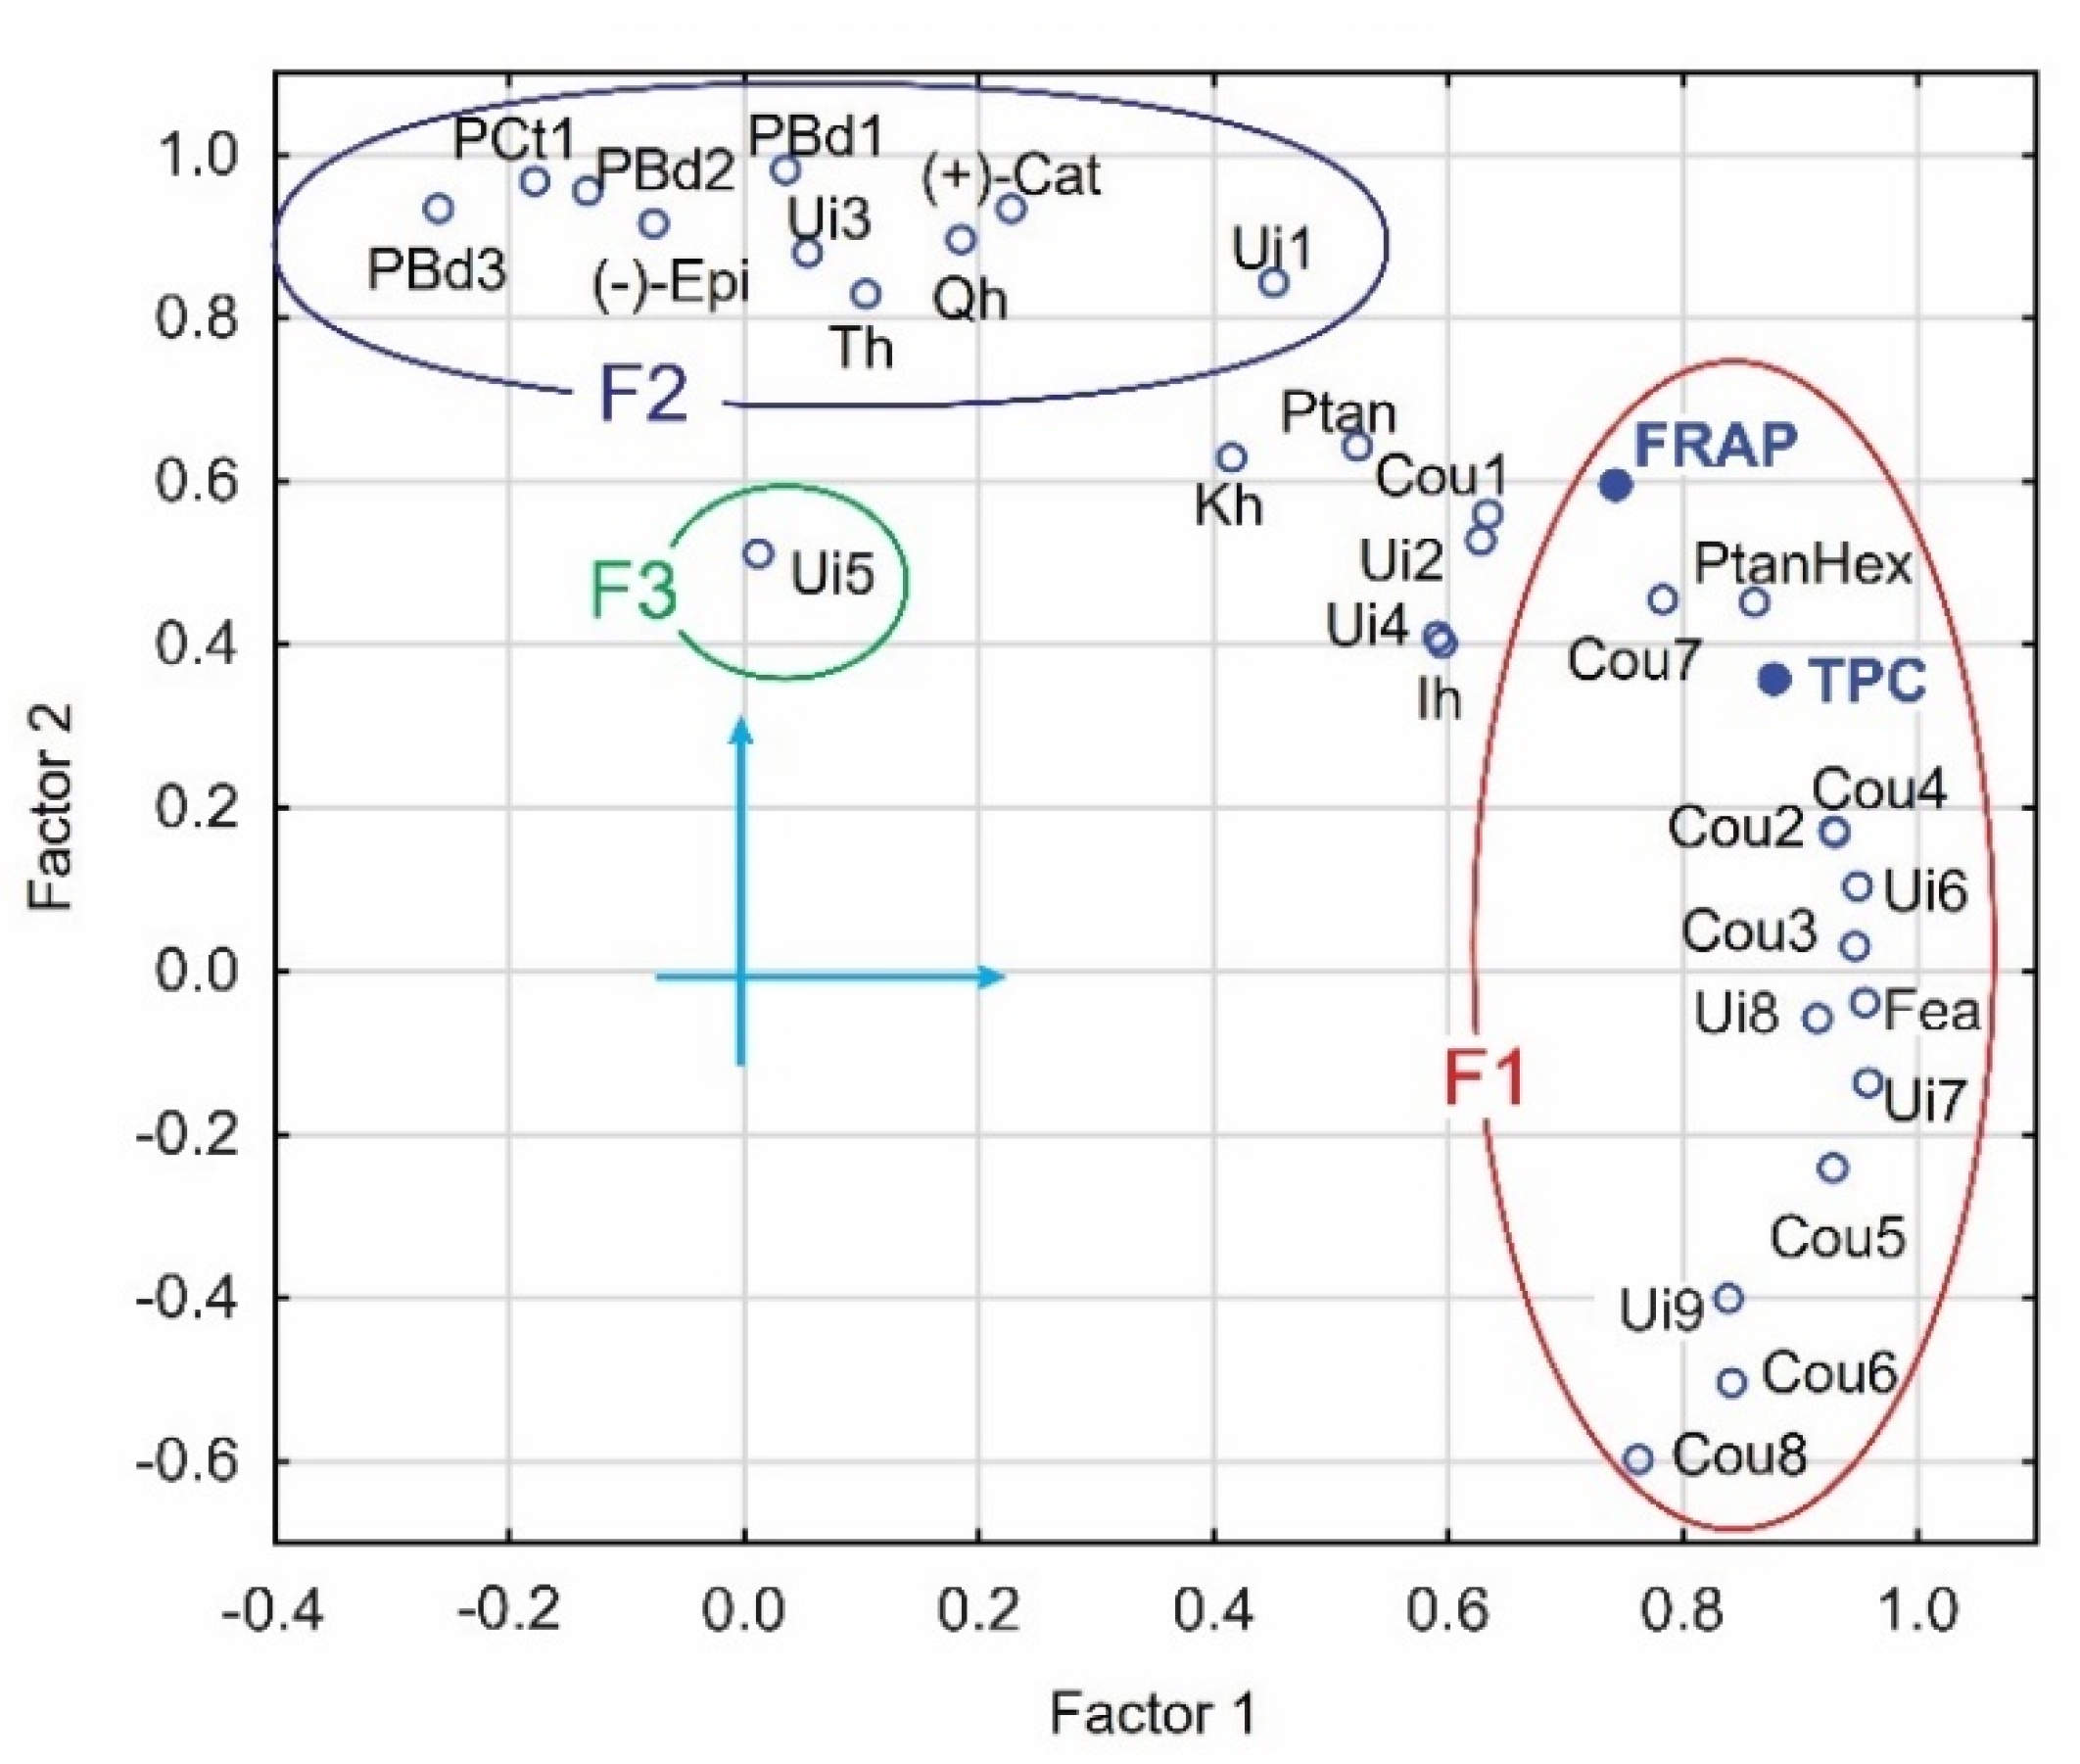
3.2.2. Factor Analysis Evaluation

Correlation analysis establishes a relationship between two variables only, while factor analysis investigates all variables together, revealing also their joint relations, thus resulting a different order of the compounds. An additional advantage of running factor analysis is that compounds with similar antioxidant properties appear as clusters in factor space by having similar factor coordinates; this also helps in the future identification of the compounds labelled as unidentified (which have significant peak areas in the HPLC-PDA chromatogram, yet their structure could not be identified from mass spectrometric data yet). Factor analysis is useful and worth applying if significant correlations are found beyond the main diagonal of the correlation matrix—as was the case with these datasets.
Factors are calculated from the transformation of individual vectors, grouped by variance. In this manner, compounds are grouped in way that also respects their relationship with antioxidant assay vectors. An additional advantage of the method is that it can help to identify the structure and chemical features of the compounds, which were left unidentified by mass spectrometric evaluation, by the grouping feature of the factors and revealing possible synergistic or antagonistic effects of the compounds [49,68,69,70].
According to the factor analysis of the data, the first three factors accounted for 93.76% of the total variance. Supplementary Table S2 includes the highest factor loading values. The factors are always orthogonal (independent) and, according to the results, each vector is determined by one factor (loading > 0.7) at the most.
Figure 2 illustrates the results of the factor analysis, indicating the vectors as the function of the first two factors. Since the variance of third factor is just 4.48%, Figure 2 only represents the vectors in the plane spanned by Factor 1 and Factor 2.
According to the results, FRAP and TPC were most closely associated with Factor 1, as were most of the phenolic acid (coumaric acid and ferulic acid) derivatives as well as piceatannol-O-hexoside and unidentified Compounds 6–9. From factor loadings, it can be assumed that these unidentified compounds can also be phenolic acid derivatives, with structures that need elucidation in the future. The highest Factor 2 loadings were determined for flavan-3-ols (catechins and procyanidins) as well as for flavonoid (quercetin and taxifolin) glycosides and Unidentified 1. Unidentified 5 was most closely correlated with Factor 3, while other compounds did not have significant loadings with either of first three factors.
The relationships between the vectors in the factor space was quantified by Euclidean distances and a scoring system. It was supposed that the vectors that are closer to the vector of the antioxidant assay (FRAP, TPC) were also more closely related to it, and were thus influencing the respective antioxidant property more significantly. Distances were determined, ordered, and the highest score 1 was assigned to the FRAP and to the TPC vector, while the most distant compound was given the score 0 comparing for FRAP and TPC vectors, respectively. Other compounds were scored proportionally to their distance parameter between [0;1]. In order to establish the overall antioxidant power of a single compound, its scores were summarized to obtain the “Sum” value (Table 3).
The scores determined for TPC and FRAP were slightly different, proving the different selectivity and behavior of compounds using various antioxidant assays [35]. Overall, the highest scores were determined for piceatannol-O-hexoside and coumaric acid derivatives 1–4 and 7, as well as for Unidentified 2 and 6. The list of the most powerful compounds was similar to that resulted by the correlation analysis; however, their order was slightly different. Nevertheless, piceatannol-O-hexoside was once again found to be the compound with the highest score. In this way, the results of the factor analysis justified correlation test outcomes, with additional selectivity for this evaluation.

3.2.3. Summary for Norway Spruce

Table 4 provides a summary of the scoring evaluation and the type (positive/negative) of the significant correlation between compound concentrations and FRAP/TPC. Overall, piceatannol-O-hexoside had the highest scores, which confirms the results of current research focused on the importance of the utilization of this compound, especially from Norway spruce bark wastes [61,62], and also on the bioactivity of this compound, already discussed in Section 3.2.1. The results also justify the relevance of chemometric evaluation for the determination of antioxidant efficiency of the compounds, as it is not always the compounds with the highest concentrations (see peak areas of Cou6 and Cou7 in Supplementary Table S1) that exhibit the strongest contributions to plant extract FRAP and TPC power, and possibly also to its bioactivity. Although Norway spruce cones contained significant amounts of (+)-catechin, this did not have the strongest contribution to its antioxidant power, unlike the extracts of other forest tree species where its contribution is almost the highest [42,47]. This also proves the importance and strength of coumaric acid derivatives and astringin as antioxidants.

3.3. Eastern Hemlock Samples Evaluation

Table S3 of the Supplementary includes the antioxidant capacity values as well as peak areas measured from the eastern hemlock aqueous acetonic extracts. In general, FRAP and TPC were higher compared to respective Norway spruce samples; the highest FRAP was measured using a 40:60 acetone:water v/v solution solvent (467.4 mg AAE/g dw.), while TPC topped using 70:30 acetone:water (126.1 mg GAE/g dw.). Not only was antioxidant capacity significantly higher, but the composition of polyphenols was also markedly different compared to Norway spruce. According to peak areas, the most abundant compounds were chlorogenic acid isomer 1, and conjugates of coumaric acid as well as kaempferol. The Unidentified 18 compound also exhibited high peak areas in the chromatogram. Extracts also included low amounts of flavan-3-ols (catechins, procyanidins) and other flavonoid glycosides. Again, the concentrations of the compounds varied with their structure in the different extracts.

3.3.1. Correlation Evaluation

Correlation analysis and scoring evaluation was conducted the same way as described in Section 3.2.1 for Norway spruce (Table 5). The only difference was that negative correlations were also experienced. In this case, the score was taken as the absolute of the R value. A negative correlation between polyphenol levels and antioxidant capacity can be interpreted in many ways. One of these ways is that these compounds must have a pro-oxidant (oxidation enhancing) effect as proved in other samples [49,54] for procyanidin compounds. In the present study, the compound showing a significant negative correlations was the procyanidin B dimer 1. Under certain circumstances, antioxidants can have pro-oxidant effects: they increase rather than decrease the concentration of free radicals speeding up oxidation reactions [70,71]. According to peak areas, the compound present in the largest amount was chlorogenic acid isomer 1, but this did not show a significant influence on FRAP and TPC levels. Chlorogenic acid proved to be a strong antioxidant in other plant samples [72]. The compound also offers many human health benefits [73,74]; however, the present sample did not confirm this. The reason for this may be that despite its high concentrations, it does not react well, or that other compounds are present in the extract, which are even stronger antioxidants.
The scores determined for FRAP and TPC were again slightly different, just as in the case of Norway spruce sample, which was explained by the different selectivity of the two assays. According to the correlation analysis, the strongest antioxidant compounds proved to be kaempferol derivatives (kaempferol-O-rutinoside isomers, kaempferol-O-pentoside 2, kaempferol-acetyl-hexoside, kaempferol-coumaric acid derivative 1) as well as unidentified 14 and procyanidin C trimer 2.
Recent literature data on kaempferol and its glycosides have proven its antitumor, antioxidant, and anti-inflammatory activities [75]. Regarding the acetylated derivative of kaempferol, Mellou et al. [76] showed that acylated (acetyl, coumaroyl, galloyl) derivatives of flavonoid glycosides have dramatically increased antioxidant and antibacterial effects compared to their corresponding glycosides; this makes the plant extracts containing such compounds especially interesting for future uses.

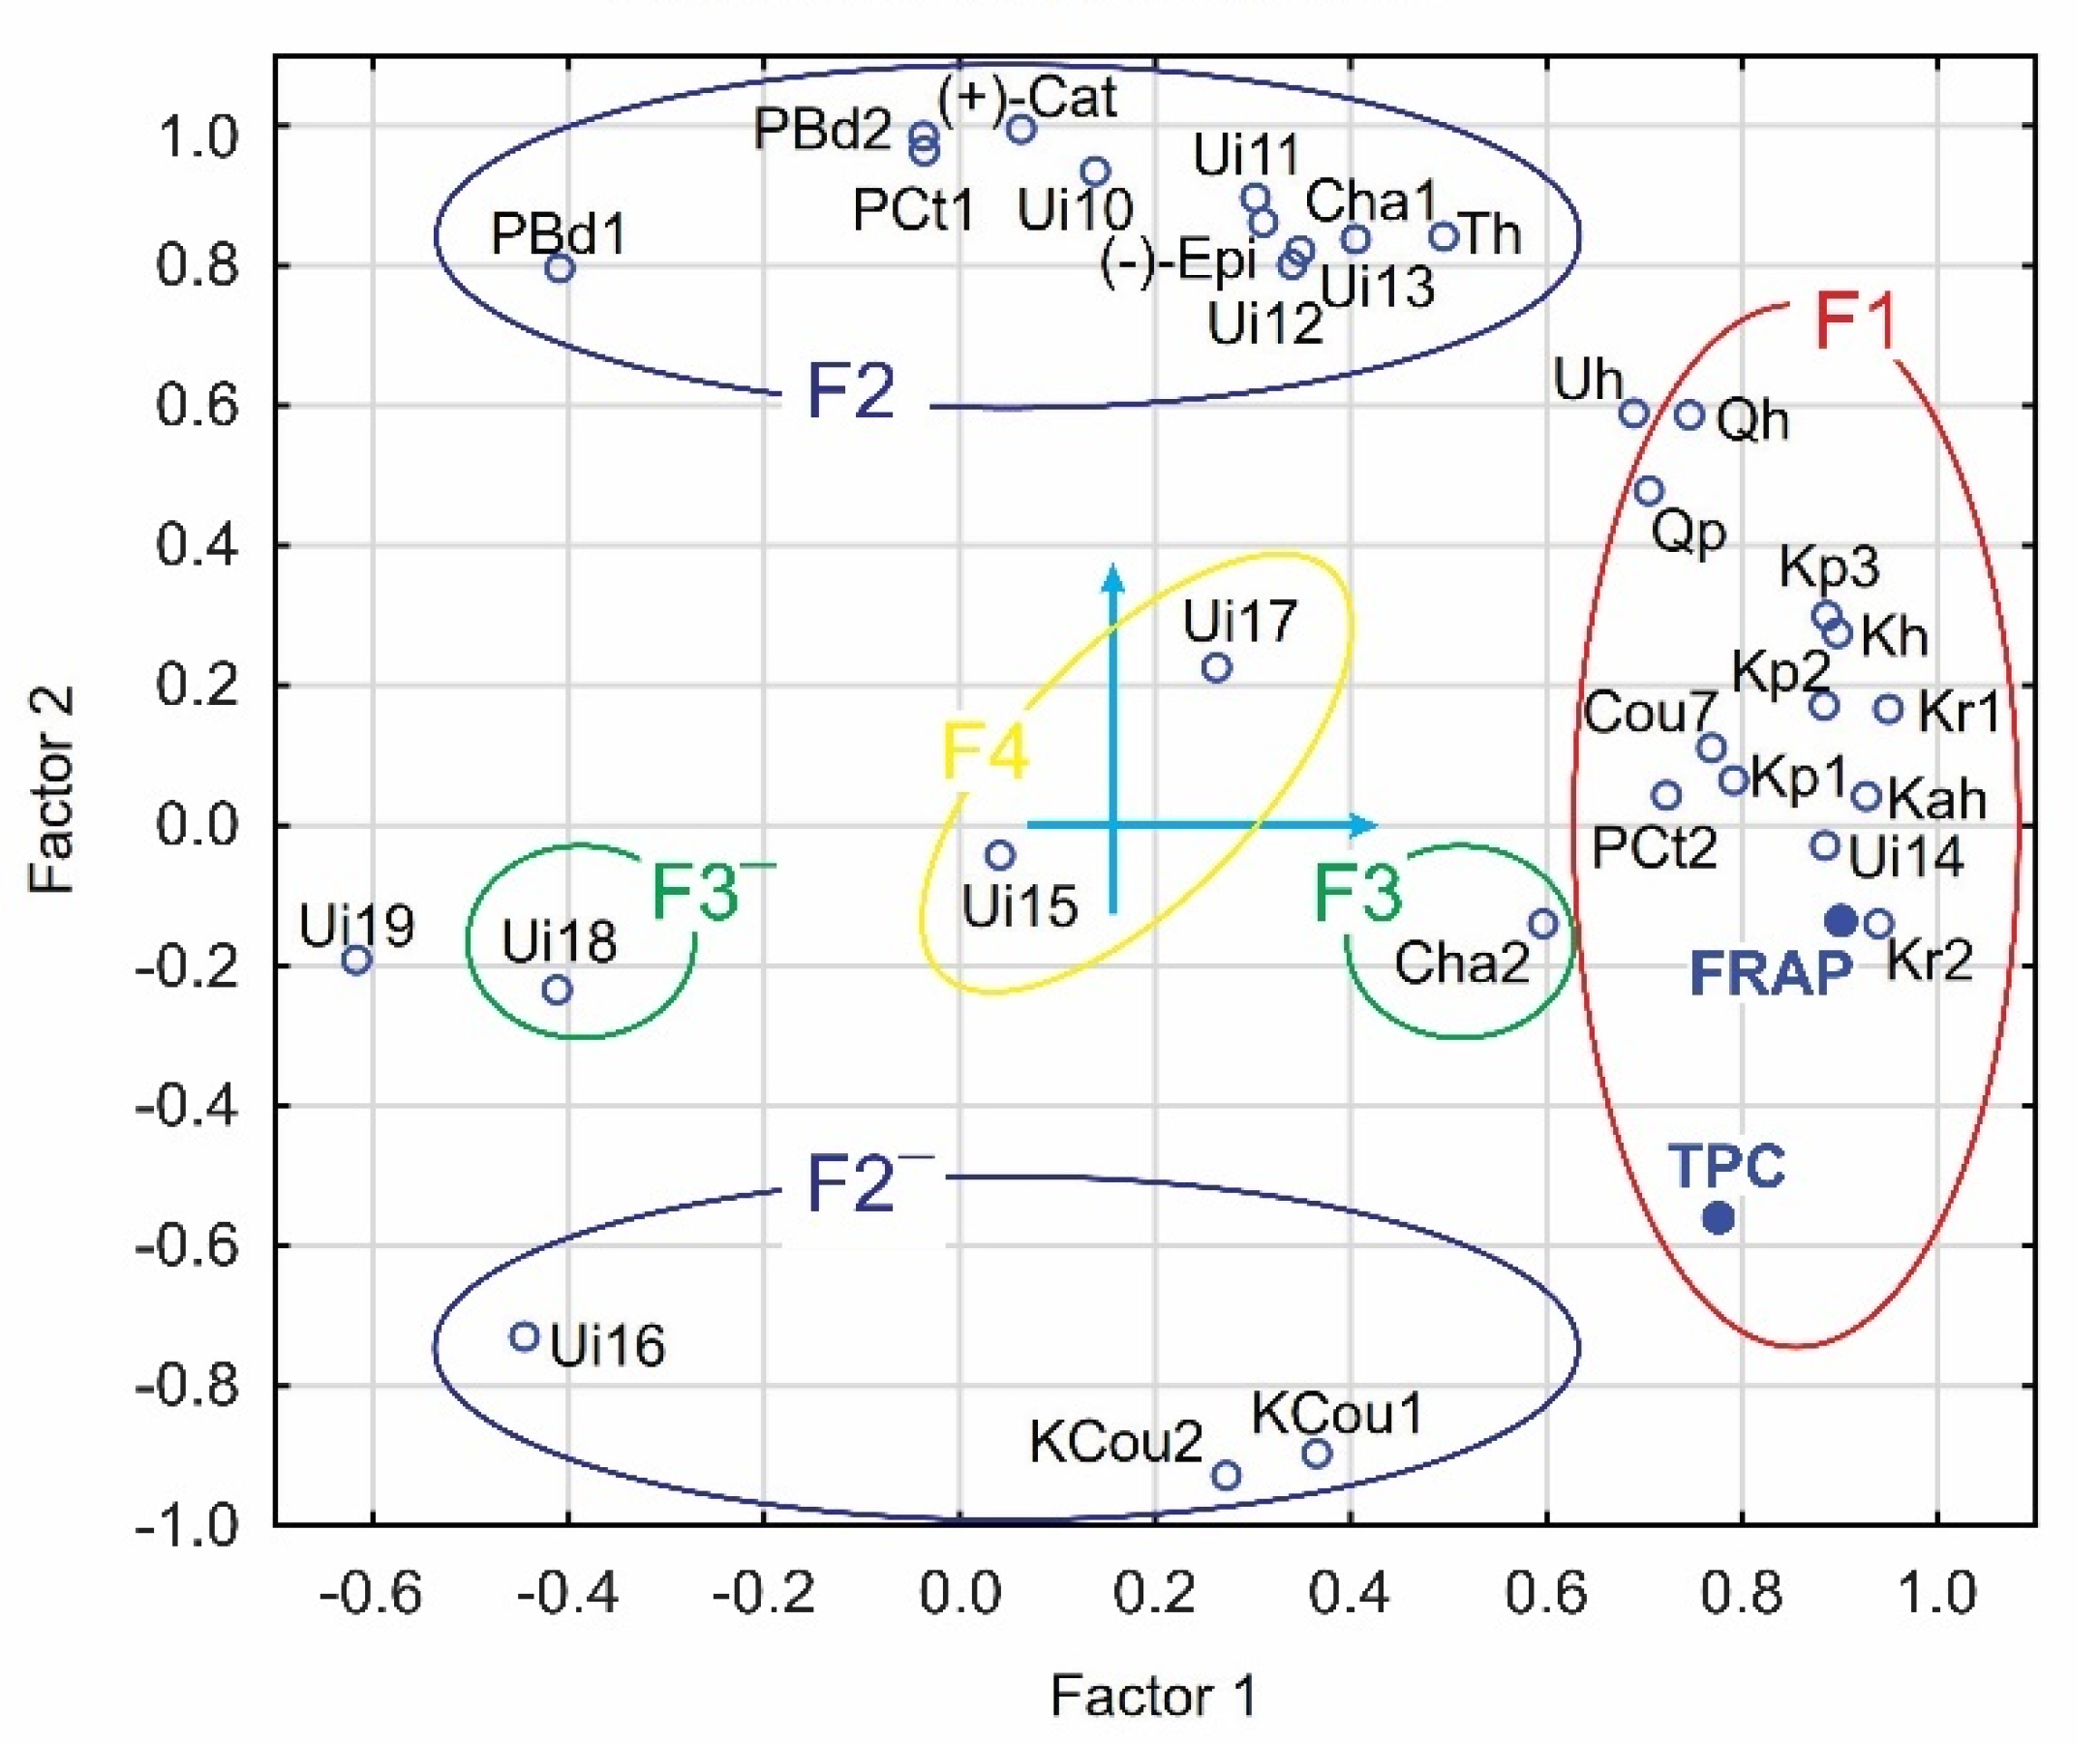
3.3.2. Factor Analysis Evaluation

According to the factor analysis, the first four factors accounted for 90.9% of the total variance. Factor loading values (>0.7) are included in Supplementary Table S4, while the vectors as the function of the first two most important factors are depicted in Figure 3.
The FRAP and TPC were most closely related to Factor 1 and so were the flavonoid (kaempferol and quercetin) derivatives, procyanidin C trimer 2, coumaric acid derivative 7 and Unidentified 14. Factor 2 was most closely related to flavan-3-ol type of compounds, taxifolin-O-hexoside, kaempferol-coumaric acid derivatives 1 and 2. Factors 3 and 4 were associated with only a few compounds.
The method of scoring evaluation of the factor analysis was similar to the one completed for Norway spruce. The results are summarized in Table 6.
The highest scores were determined for kaempferol conjugates, procyanidin C trimer 2 and unidentified 14 compounds. Score results and order of the compounds were similar to that of the correlation analysis.

3.3.3. Summary for Eastern Hemlock

Summary of the scoring evaluation and the type (positive/negative) of the significant correlation between compound concentrations and FRAP/TPC is given in Table 7.
Overall, the highest scores were found for kaempferol-O-rutinoside 2 (3.39), Unidentified 14 (3.17), kaempferol-O-hexoside (2.90), kaempferol-O-pentoside 2 (2.77), kaempferol-O-rutinoside 1 (2.59) and procyanidin C trimer 2 (2.57).
According to the sum of scores, the contribution of kaempferol conjugates is the most significant, and surprisingly compounds with high concentrations (e.g., chlorogenic acid isomer 1) showed a low contribution to the overall antioxidant effects. The significant positive correlations for the first four compounds with the highest sum of scores also correlated significantly with FRAP and TPC concentrations. One compound (procyanidin B dimer 1) showed negative correlation with antioxidant capacity, possibly due to pro-oxidant effects, which require further explanation.
As compound Unidentified 14 had the second highest score, information on its structure is important regarding future extraction optimization and utilization of the extracts as well as to the study of its role in possible bioactive effects.
Bioactive effects were studied in the present research by investigating antibacterial effects on the extracts obtained by the 50:50 acetone water v/v solvent extraction, which yielded the one of the highest antioxidant capacity solutions.

3.4. Antibacterial Effects of the Cone Extracts

The antibacterial effect of four cone extracts (EHGC, EHMC, NSGC, NSMC) was measured using three antimicrobial assays (DDT, MIC and MIC with the following growth curve). In the case of DDT, which was used as a qualitative method [77], the antibacterial activity of the extracts was evaluated visually by measuring the diameter of the inhibition zones around the paper disc. All tested extracts exhibited a very weak inhibition against the Gram-positive strain S. aureus and did not form any area of inhibition with the Gram-negative strain E. coli (Table 8). Earlier studies on Norway spruce reported antibacterial effects on Gram-positive bacteria, such as S. aureus [78,79] and no effect or very low effect on the Gram-negative bacteria [80]; however, these studies investigated sapwood, heartwood and resin samples and not the cones.
The findings of the DDT were supported by evaluation of other antimicrobial assays (MIC and growth curve). The tested concentration range for MIC assay was measured from 0.016 mg/mL to 1.0 mg/mL. All of the investigated extracts exhibited antibacterial activity of both bacterial strains after 15 h, although extracts showed a higher antibacterial effect on the Gram-positive bacterium S. aureus. An inhibitory effect was detected in the whole concentration range, resulting in the IC50 values summarized in Table 9. The inhibitory effects of the NSGC sample were so low that they could not be evaluated. A difference in inhibitory effect between the extracts of green and mature eastern hemlock cones was not observed, which showed the overall best IC50 value of 0.25 mg/mL.
The investigation of bacterial growth curves (Figure 4 and Figure 5) was also evaluated as a following assay in order to determine a more accurate MIC value (Table 10) due to a wider concentration range after 20 h. The growth curve of S. aureus was inhibited by all tested extracts. The highest inhibition was observed in the cases of extracts EHMC (0.004 mg/mg) and NSMC (0.008 mg/mL), demonstrating that mature cones exhibit higher antibacterial activity than green cones, despite green cones showing higher antioxidant activity compared to mature cones in general [44]. A possible explanation of this may be that green tissues also contain higher amounts of nutrients (e.g., sugars, amino acids, etc.), which can be of a reducing type, thus contributing significantly to high antioxidant capacity, yet with no or even reverse (growth inducing) bioactive effects due to being nutrients. Such an effect is lower in mature cones. This explanation is justified by the fact that, according to earlier studies of the authors in the case of the two investigated taxa, the polyphenol pool of the green and mature cones is similar (unpublished results). Fyhrquist et al. [81] tested extracts prepared from Norway spruce needles and bark and recorded a promising antibacterial effect against S. aureus and Bacillus cereus (MIC 0.01075 mg/mL) as well as against Gram-negative Salmonella enterica (MIC 0.043 mg/mL).
In this study, none of the tested extracts showed inhibition on the E. coli strain, as seen in the example of NSCG extract (Figure 3). Similar results had been determined for the sapwood and heartwood extracts of Norway spruce earlier [82], while the study of Tanase et al. [83] revealed an antibacterial effect of polyphenols extracted from Norway spruce bark against Gram-negative bacteria with a MIC of 7.5 mg/mL. Tanase et al. [83] revealed an antibacterial effect of polyphenols extracted from Norway spruce bark against Gram-negative bacteria with a MIC of 7.5 mg/mL, while Haman et al. investigated the effects of essential oils obtained from wood residues of Picea abies against the growth of E. coli [84].
Semerci et al. [85] compared the methanolic extracts of the cones of five coniferous taxa and concluded that there was a measurable antibacterial activity against E. coli. only in the case of Cedrus libani.
In a comparative study of the essential oils of four Pinus species, Mitic et al. [86] observed that the sensitivity of the tested bacterial pathogens is related to the cell wall structure. Different mechanisms of action can explain the antimicrobial activities of cones, and their wide variety of molecular components can act at multiple levels [87]. Generally, Gram-negative bacteria are more resistant than Gram-positive bacteria because the cell wall does not allow entrance into the cell of hydrophobic molecules present in the cone extracts [88,89]. Nevertheless, some exceptions have been shown [90,91].

4. Conclusions

The present study evaluated the cone extractives of Norway spruce and eastern hemlock using multiassay antioxidant capacity measurements, liquid chromatography/diode array detection/tandem mass spectrometry. A scoring system was implemented to evaluate data of the correlation analysis and factor analysis of the data to identify the compounds which contribute most to the high antioxidant capacity of the cone extracts. In Norway spruce, the compounds with the highest antioxidant efficiency were found to be piceatannol-O-hexoside and coumaric acid conjugates. In eastern hemlock, the kaempferol conjugates, as well as the procyanidin C trimer isomer and a hitherto-unidentified compound, were shown to have the highest antioxidant efficiency. Surprisingly, the compounds with the highest concentrations (N. spruce: coumaric acid derivative 6; e. hemlock: chlorogenic acid) did not exhibit the highest antioxidant efficiency. The green and mature cone extracts did not suggest any promising antimicrobial activity against E. coli; an inhibitory effect was only observed on S. aureus, with the best values for mature cones of both taxa. The results indicate that the mature cone extracts of N. spruce and e. hemlock exhibit higher antimicrobial activity against S. aureus strain and may serve as a potential source of natural antimicrobials for various purposes. This warrants further investigation. The other bioactive effects of the extracts also need to be evaluated in the future.

Supplementary Materials

The following are available online at https://www.mdpi.com/article/10.3390/f12091189/s1, Table S1: Peak areas (from UV 250–380 nm chromatograms) of the different compounds separated from aqueous acetonic extracts of Norway spruce cones. FRAP and TPC indicate the antioxidant capacity of the extracts, Table S2: Results of the factor analysis involving the FRAP and TPC antioxidant capacity as well as peak areas of Norway spruce cone extracts. Factor loadings were calculated with the Varimax normalized method. Only the highest factor values (>0.7) were indicated. Cumulative total variance of the three factors was: 93.76%; Table S3: Peak areas (from UV 250–380 nm chromatograms) of the different compounds separated from aqueous/acetonic extracts of eastern hemlock cones. FRAP and TPC indicate the antioxidant capacity of the extracts; Table S4: Results of the factor analysis involving the FRAP and TPC antioxidant capacity as well as peak areas of eastern hemlock cone extracts. Factor loadings were calculated with the Varimax normalized method. Only the highest factor values (>0.7) were indicated. Cumulative total variance of the four factors was 90.9%.

Author Contributions

Conceptualization, T.H., E.V.-R., L.N. and M.V.; methodology, E.V.-R., N.S.; software, L.N.; formal analysis, L.N.; investigation, N.S. and E.V.-R.; resources, writing—original draft preparation, T.H., E.V.-R., L.N., N.S., M.V.; writing—review and editing, T.H., L.A., S.V. and M.V.; visualization, T.H. and M.V.; project administration, L.A.; funding acquisition, L.A. Please turn to the CRediT taxonomy for the term explanation. Authorship must be limited to those who have contributed substantially to the work reported. All authors have read and agreed to the published version of the manuscript.

Funding

The research was made in frame of the “EFOP-3.6.1-16-2016-00018—Improving the role of research, development, and innovation in higher education through institutional developments assisting intelligent specialization in Sopron and Szombathely”. The research was supported by the ÚNKP-20-5-12 New National Excellence Program of the Ministry for Innovation and Technology from the source of the National Research, Development and Innovation Fund and by the János Bolyai Research Scholarship of the Hungarian Academy of Sciences and by the ERDF “Multidisciplinary research to increase application potential of nanomaterials in agricultural practice” (No. CZ.02.1.01/0.0/0.0/16_025/0007314).

Institutional Review Board Statement

Not applicable.

Informed Consent Statement

Not applicable.

Data Availability Statement

The data presented in this study are available on request from the corresponding author. The data are not publicly available due to their complexity.

Conflicts of Interest

The authors declare no conflict of interest.

References

  1. Pásztory, Z.; Mohácsi-Ronyecz, I.; Gorbacheva, G.; Börcsök, Z. The utilization of tree bark. Bioresources 2016, 11, 7859–7888. [Google Scholar] [CrossRef]
  2. Molino, A.; Mehariya, S.; Di Sanzo, G.; Larocca, V.; Martino, M.; Leone, G.P.; Marino, T.; Chianese, S.; Balducchi, R.; Musmarra, D. Recent developments in supercritical fluid extraction of bioactive compounds from microalgae: Role of key parameters, technological achievements and challenges. J. CO2 Util. 2020, 36, 196–209. [Google Scholar] [CrossRef]
  3. Wen, C.; Zhang, J.; Zhang, H.; Dzah, C.S.; Zandile, M.; Duan, Y.; Ma, H.; Luo, X. Advances in ultrasound assisted extraction of bioactive compounds from cash crops—A review. Ultrason. Sonochem. 2018, 48, 538–549. [Google Scholar] [CrossRef] [PubMed]
  4. Zainal-Abidin, M.H.; Hayyan, M.; Hayyan, A.; Jayakumar, N.S. New horizons in the extraction of bioactive compounds using deep eutectic solvents: A review. Anal. Chim. Acta 2017, 979, 1–23. [Google Scholar] [CrossRef]
  5. Tümen, I.; Akkol, E.K.; Taştan, H.; Süntar, I.; Kurtca, M. Research on the antioxidant, wound healing, and anti-inflammatory activities and the phytochemical composition of maritime pine (Pinus pinaster Ait). J. Ethnopharm. 2018, 211, 235–246. [Google Scholar] [CrossRef]
  6. Jablonský, M.; Nosálová, J.; Sládková, A.; Ház, A.; Kreps, F.; Valka, J.; Miertuš, S.; Frecer, V.; Ondrejovič, M.; Šima, J.; et al. Valorisation of softwood bark through extraction of utilizable chemicals. Biotechnol. Adv. 2017, 35, 726–750. [Google Scholar] [CrossRef]
  7. Ferreira-Santos, P.; Genisheva, Z.; Botelho, C.; Santos, J.; Ramos, C.; Teixeira, J.A.; Rocha, C.M.R. Unravelling the biological potential of pinus pinaster bark extracts. Antioxidants 2020, 9, 334. [Google Scholar] [CrossRef] [PubMed] [Green Version]
  8. Burčová, Z.; Kreps, F.; Greifová, M.; Jablonský, M.; Ház, A.; Schmidt, Š.; Šurina, I. Antibacterial and antifungal activity of phytosterols and methyl dehydroabietate of Norway spruce bark extracts. J. Biotechnol. 2018, 282, 18–24. [Google Scholar] [CrossRef]
  9. Khan, I.U.; Shah, A.A.; Sahibzada, F.A.; Hayyat, A.; Nazar, M.; Mobashar, M.; Tariq, A.; Sultana, N. Carcass characteristics and serum biochemical profile of Japanese quail by the supplementation of pine needles and vitamin E powder. Biologia 2019, 74, 993–1000. [Google Scholar] [CrossRef]
  10. Gulsoy, S.K.; Ozturk, F. Kraft pulping properties of european black pine cone. Maderas Cienc. Y Tecnol. 2016, 17, 875–882. [Google Scholar] [CrossRef] [Green Version]
  11. Tukan, S.K.; Al-Ismail, K.; Ajo, R.Y.; Al-Dabbas, M.M. Seeds and seed oil compositions of Aleppo pine (Pinus halepensis Mill.) grown in Jordan. Riv. Ital. Delle Sostanze Grasse 2013, 90, 87–93. [Google Scholar]
  12. Ferreira-Santos, P.; Zanuso, E.; Genisheva, Z.; Rocha, C.M.R.; Teixeira, J.A. Green and Sustainable Valorization of Bioactive Phenolic Compounds from Pinus By-Products. Molecules 2020, 25, 2931. [Google Scholar] [CrossRef]
  13. Dedrie, M.; Jacquet, N.; Bombeck, P.L.; Hébert, J. Oak barks as raw materials for the extraction of polyphenols for the chemical and pharmaceutical sectors: A regional case study. Ind. Crop. Prod. 2015, 70, 316–321. [Google Scholar] [CrossRef]
  14. Bouras, M.; Grimi, N.; Bals, O.; Vorobiev, E. Impact of pulsed electric fields on polyphenols extraction from Norway spruce bark. Ind. Crop. Prod. 2016, 80, 50–58. [Google Scholar] [CrossRef]
  15. Packer, L.; Rimbach, G.; Virgili, F. Antioxidant activity and biologic properties of procyanidin-rich extract from pine (Pinus maritima) bark, pycnogenol. Free Radic. Biol. Med. 1999, 27, 704–724. [Google Scholar] [CrossRef]
  16. Dzialo, M.; Mierziak, J.; Korzun, U.; Preisner, M.; Szopa, J.; Kulma, A. The potential of plant phenolics in prevention and therapy of skin disorders. Int. J. Mol. Sci. 2016, 17, 160. [Google Scholar] [CrossRef] [PubMed] [Green Version]
  17. Watson, R.R.; Preedy, V.R.; Zibadi, S. Polyphenols: Prevention and Treatment of Human Disease, 2nd ed.; Academic Press: London, UK, 2018; p. 484. [Google Scholar]
  18. Coté, J.; Caillet, S.; Doyon, G.; Dussault, D.; Sylvain, J.F.; Lacroix, M. Antimicrobial effect of cranberry juice and extracts. Food Control 2011, 22, 1413–1418. [Google Scholar] [CrossRef]
  19. Gyawali, R.; Ibrahim, S.A. Natural products as antimicrobial agents. Food Control 2014, 46, 412–429. [Google Scholar] [CrossRef]
  20. Kobus-Cisowska, J.; Flaczyk, E.; Rudzińska, M.; Kmiecik, D. Antioxidant properties of extracts from Ginkgo biloba leaves in meatballs. Meat Sci. 2014, 97, 174–180. [Google Scholar] [CrossRef] [PubMed]
  21. Frydman, A.; Weisshaus, O.; Huhman, D.V.; Sumner, L.W.; Bar-Peled, M.; Lewinsohn, E.; Fluhr, R.; Gressel, J.; Eyal, Y. Metabolic engineering of plant cells for biotransformation of hesperidin into neohesperidin, a substrate for production of the low-calorie sweetener and flavor enhancer NHDC. J. Agric. Food Chem. 2005, 53, 9708–9712. [Google Scholar] [CrossRef]
  22. Popa, V.I.; Dumitru, M.; Volf, I.; Anghel, N. Lignin and polyphenols as allelochemicals. Ind. Crop. Prod. 2008, 27, 144–149. [Google Scholar] [CrossRef]
  23. Vyvyan, J.R. Allelochemicals as leads for new herbicides and agrochemicals. Tetrahedron 2002, 58, 1631–1646. [Google Scholar] [CrossRef]
  24. Fahimirada, S.; Ajalloueian, F.; Ghorbanpour, M. Synthesis and therapeutic potential of silver nanomaterials derived from plant extracts. Ecotox. Environ. Safe 2019, 168, 260–278. [Google Scholar] [CrossRef] [PubMed]
  25. Rolim, W.R.; Pelegrino, M.T.; Lima, B.A.; Ferraz, L.S.; Costa, F.N.; Bernardes, J.S.; Rodigues, T.; Brocchi, M.; Seabra, A.B. Green tea extract mediated biogenic synthesis of silver nanoparticles: Characterization, cytotoxicity evaluation and antibacterial activity. App. Surf. Sci. 2019, 463, 66–74. [Google Scholar] [CrossRef]
  26. Watanabe, K.; Momose, F.; Handa, H.; Nagata, K. Interaction between influenza virus proteins and pine cone antitumor substance that inhibits the virus multiplication. Biochem. Biophys. Res. Commun. 1995, 214, 318–323. [Google Scholar] [CrossRef] [PubMed]
  27. Lesjak, M.M.; Beara, I.N.; Orčić, D.Z.; Anačkov, G.T.; Balog, K.J.; Francišković, M.M.; Mimica-Dukić, N.M. Juniperus sibirica Burgsdorf. as a novel source of antioxidant and anti-inflammatory agents. Food Chem. 2011, 124, 850–856. [Google Scholar] [CrossRef]
  28. Süntar, I.; Tumen, I.; Ustün, O.; Keles, H.; Akkol, E.K. Appraisal on the wound healing and anti-inflammatory activities of the essential oils obtained from the cones and needles of Pinus species by in vivo and in vitro experimental models. J. Ethnopharmacol. 2012, 139, 533–540. [Google Scholar] [CrossRef]
  29. Djouahri, A.; Saka, B.; Boudarene, L.; Benseradj, F.; Aberrane, S.; Aitmoussa, S.; Chelghoum, C.; Lamari, L.; Sabaou, N.; Baaliouamer, A. In vitro synergistic/antagonistic antibacterial and anti-inflammatory effect of various extracts/essential oil from cones of Tetraclinis articulata (Vahl) Masters with antibiotic and anti-inflammatory agents. Ind. Crop. Prod. 2014, 56, 60–66. [Google Scholar] [CrossRef]
  30. Nagata, K.; Sakagami, H.; Harada, H.; Nonoyama, M.; Ishihama, A.; Konno, K. Inhibition of influenza virus infection by pine cone antitumor substances. Antivir. Res. 1990, 13, 11–22. [Google Scholar] [CrossRef]
  31. Nagasawa, H.; Sakamoto, S.; Sawaki, K. Inhibitory effect of lignin-related pine cone extract on cell proliferating enzyme activity of spontaneous mammary tumours in mice. Anticancer. Res. 1992, 12, 501–503. [Google Scholar]
  32. Tumen, I.; Senol, F.S.; Orhan, I.E. Evaluation of possible in vitro neurobiological effects of two varieties of Cupressus sempervirens (Mediterranean cypress) through their antioxidant and enzyme inhibition actions. Turk. J. Biochem. 2012, 37, 5–13. [Google Scholar] [CrossRef]
  33. Bradley, W.G.; Holm, K.N.; Tanaka, A. An orally active immune adjuvant prepared from cones of Pinus sylvestris, enhances the proliferative phase of a primary T cell response. BMC Complement. Altern. Med. 2014, 14, 163. [Google Scholar] [CrossRef] [Green Version]
  34. Wang, L.; Li, X.; Wang, H. Physicochemical properties, bioaccessibility and antioxidant activity of the polyphenols from pine cones of Pinus koraiensis. Int. J. Biol. Macromol. 2019, 126, 385–391. [Google Scholar] [CrossRef]
  35. Hofmann, T.; Visi-Rajczi, E.; Albert, L. Antioxidant properties assessment of the cones of conifers through the combined evaluation of multiple antioxidant assays. Ind. Crop. Prod. 2020, 145, 111935. [Google Scholar] [CrossRef]
  36. Bajpai, V.K.; Sharma, A.; Kang, S.C.; Baek, K.H. Antioxidant, lipid peroxidation inhibition and free radical scavenging efficacy of a diterpenoid compound sugiol isolated from Metasequoia glyptostroboides. Asian Pac. J. Trop. Med. 2014, 7, 9–15. [Google Scholar] [CrossRef] [Green Version]
  37. Horiba, H.; Nakagawa, T.; Zhu, Q.; Ashour, A.; Watanabe, A.; Shimizu, K. Biological activities of extracts from different Parts of Cryptomeria japonica. Nat. Prod. Commun. 2016, 11, 1337–1342. [Google Scholar] [CrossRef] [Green Version]
  38. Yogesh, K.; Ali, J. Antioxidant potential of thuja (Thuja occidentalis) cones and peach (Prunus persia) seeds in raw chicken ground meat during refrigerated (4 ± 1 °C) storage. J. Food Sci. Technol. 2014, 51, 1547–1553. [Google Scholar] [CrossRef] [PubMed] [Green Version]
  39. Kilinc, M.; Canbolat, S.; Merdan, N.; Dayioglu, H.; Akin, F. Investigation of the color, fastness and antimicrobial properties of wool fabrics dyed with the natural dye extracted from the cone of Chamaecyparis lawsoniana. Procedia. Soc. Behav. Sci. 2015, 195, 2152–2159. [Google Scholar] [CrossRef] [Green Version]
  40. Meloni, M.; Perini, D.; Binelli, G. The distribution of genetic variation in Norway spruce (Picea abies Karst.) populations in the Western Alps. J. Biogeogr. 2007, 34, 929–938. [Google Scholar] [CrossRef]
  41. Lamedica, S.; Lingua, E.; Popa, I.; Motta, R.; Carrer, M. Spatial structure in four Norway spruce stands with different management history in the Alps and Carpathians. Silva. Fenn. 2011, 45, 865–873. [Google Scholar] [CrossRef] [Green Version]
  42. Clark, J.T.; Fei, S.; Liang, L.; Rieske, R.K. Mapping eastern hemlock: Comparing classification techniques to evaluate susceptibility of a fragmented and valued resource to an exotic invader, the hemlock woolly adelgid. For. Ecol. Manag. 2012, 266, 216–222. [Google Scholar] [CrossRef]
  43. Mcwilliams, W.H.; Schmidt, T.L. Composition, structure, and sustainability of hemlock ecosystems in eastern North America. In Proceedings: Symposium on Sustainable Management of Hemlock Ecosystems in Eastern North America, USDA Forest Service Northeastern Forest Experiment Station General Technical Report NE-267; McManus, K.A., Shields, K.S., Souto, D.R., Eds.; U.S. Department of Agriculture, Forest Service, Northeastern Forest Experiment Station: Newtown Square, PA, USA, 2000; pp. 5–10. [Google Scholar]
  44. Hofmann, T.; Visi-Rajczi, E.; Bocz, B.; Bocz, D.; Albert, L. Antioxidant capacity and tentative identification of polyphenolic compound of cones of selected coniferous species. Acta Silv. Lignaria. Hungarica. 2020, 16, 79–94. [Google Scholar] [CrossRef]
  45. Singleton, V.L.; Rossi, J.A. Colorimetry of total phenolics with phosphomolibdic-phosphotungstic acid reagents. Am. J. Enol. Vitic. 1965, 161, 144–158. [Google Scholar]
  46. Benzie, I.F.F.; Strain, J.J. The ferric reducing ability of plasma (FRAP) as a measure of antioxidant power: The FRAP assay. Anal. Biochem. 1996, 239, 70–76. [Google Scholar] [CrossRef] [Green Version]
  47. EUCAST. Available online: https://eucast.org/fileadmin/src/media/PDFs/EUCAST_files/RAST/EUCAST_RAST_methodology_v1.1_Final.pdf (accessed on 1 June 2021).
  48. EUCAST. Available online: https://www.eucast.org/fileadmin/src/media/PDFs/EUCAST_files/Disk_test_documents/2020_manuals/Reading_guide_BMD_v_2.0_2020.pdf (accessed on 1 June 2021).
  49. Hofmann, T.; Tálos-Nebehaj, E.; Albert, L.; Németh, L. Antioxidant efficiency of beech (Fagus sylvatica L.) bark polyphenols assessed by chemometric methods. Ind. Crop. Prod. 2017, 108, 26–35. [Google Scholar] [CrossRef]
  50. Prior, R.; Cao, G. In vivo total antioxidant capacity: Comparison of different analytical methods. Free Radic. Biol. Med. 1999, 27, 1173–1181. [Google Scholar] [CrossRef]
  51. Do, Q.D.; Angkawijaya, A.E.; Tran-Nguyen, P.L.; Huynh, L.H.; Soetaredjo, F.E.; Ismadji, S.; Ju, Y.-H. Effect of extraction solvent on total phenol content, total flavonoid content, and antioxidant activity of Limnophila aromatica. J. Food Drug Anal. 2014, 22, 296–302. [Google Scholar] [CrossRef] [Green Version]
  52. Dai, J.; Mumper, R.J. Plant phenolics: Extraction, analysis and their antioxidant and anticancer properties. Molecules 2010, 15, 7313–7352. [Google Scholar] [CrossRef] [PubMed]
  53. Cadahía, E.; Fernández De Simón, B.; Aranda, I.; Sanz, M.; Sánchez-Gómez, D.; Pint, E. Non-targeted metabolomic profile of Fagus sylvatica L. leaves using liquid chromatography with mass spectrometry and gas chromatography with mass spectrometry. Phytochem. Anal. 2015, 26, 171–182. [Google Scholar] [CrossRef] [PubMed]
  54. Visi-Rajczi, E.; Hofmann, T.; Albert, L.; Mátyás, C. Tracing the acclimation of European beech (Fagus sylvatica L.) populations to climatic stress by analyzing the antioxidant system. iForest 2021, 14, 95–103. [Google Scholar] [CrossRef]
  55. Lindberg, M.; Lundgren, R.; Gref, R.; Johansson, M. Stilbenes and resin acids in relation to the penetration of Heterobasidion annosum through the bark of Picea abies. Eur. J. For. Path. 1992, 22, 95–106. [Google Scholar] [CrossRef]
  56. Metsämuuronen, S.; Sirén, H. Bioactive phenolic compounds, metabolism and properties: A review on valuable chemical compounds in Scots pine and Norway spruce. Phytochem. Rev. 2019, 18, 623–664. [Google Scholar] [CrossRef] [Green Version]
  57. Aritomi, M.; Donnelly, D.M.X. Stilbene glycosides in the bark of Picea sitchensis. Phytochemistry 1976, 15, 2006–2008. [Google Scholar] [CrossRef]
  58. Underwood, C.D.T.; Pearce, R.B. Astringin and isorhapontin distribution in Sitka Spruce trees. Phytochemistry 1991, 30, 2183–2189. [Google Scholar] [CrossRef]
  59. Guerro, R.F.; Aliano-González, M.J.; Puertas, B.; Richard, T.; Cantos-Villar, E. Comparative analysis of stilbene concentration in grapevine shoots of thirteen Vitis during a three-year study. Ind. Crop. Prod. 2020, 156, 112852. [Google Scholar] [CrossRef]
  60. Benbouguerra, N.; Hornedo-Ortega, R.; Garcia, F.; Khawand, T.E.; Saucier, C.; Richard, T. Stilbenes in grape berries and wine and their potential role as anti-obesity agents: A review. Trends Food Sci. Technol. 2021, 112, 362–381. [Google Scholar] [CrossRef]
  61. Jyske, T.; Laakso, T.; Latva-Maenpaa, H.; Tapanila, T. Yield of stilbene glucosides from the bark of young and old Norway spruce stems. Biomass Bioenerg. 2014, 71, 216–227. [Google Scholar] [CrossRef]
  62. Valimaa, A.L.; Raitanen, J.E.; Tienaho, J.; Sarjala, T.; Nakayama, E.; Korpinen, R.; Makinen, S.; Eklund, P.; Willför, S.; Jyske, T. Enhancement of Norway spruce bark side-streams: Modification of bioactive and protective properties of stilbenoid-rich extracts by UVA-irradiation. Ind. Crop. Prod. 2020, 145, 112150. [Google Scholar] [CrossRef]
  63. Gabaston, J.; Richard, T.; Biais, B.; Waffo-Teguo, P.; Pedrot, E.; Jourdes, M.; Corio-Costet, M.F.; Mérillon, J.M. Stilbenes from common spruce (Picea abies) bark as natural antifungal agent against downy mildew (Plasmopara viticola). Ind. Crop. Prod. 2017, 103, 267–273. [Google Scholar] [CrossRef]
  64. Le, T.K.; Jang, H.H.; Nguyen, H.T.H.; Doan, T.T.M.; Lee, G.J.; Park, K.D.; Ahn, T.; Joung, Y.H.; Kang, H.S.; Yun, C.H. Highly regioselective hydroxylation of polydatin, a resveratrol glucoside, for one-step synthesis of astringin, a piceatannol glucoside, by P450 BM3. Enzym. Microb. Technol. 2017, 97, 34–42. [Google Scholar] [CrossRef]
  65. Taofiq, O.; González-Paramás, A.M.; Barreiro, M.F.; Ferreira, I.C.F.R. Hydroxycinnamic Acids and Their Derivatives: Cosmeceutical Significance, Challenges and Future Perspectives, a Review. Molecules 2017, 22, 281. [Google Scholar] [CrossRef]
  66. Pei, K.; Ou, J.; Huang, J.; Ou, S. p-Coumaric acid and its conjugates: Dietary sources, pharmacokinetic properties and biological activities. J. Sci. Food Agric. 2016, 96, 2952–2962. [Google Scholar] [CrossRef]
  67. Kwak, J.Y.; Park, S.; Seok, J.K.; Liu, K.H.; Boo, Y.C. Ascorbyl coumarates as multifunctional cosmeceutical agents that inhibit melanogenesis and enhance collagen synthesis. Arch. Dermatol. Res. 2015, 307, 635–643. [Google Scholar] [CrossRef] [PubMed]
  68. Hajimehdipoor, H.; Shahrestani, R.; Shekarchi, M. Investigating the synergistic antioxidant effects of some flavonoid and phenolic compounds. Res. J. Pharmacogn. 2014, 1, 35–40. [Google Scholar]
  69. Peyrat-Maillard, M.; Cuvelier, M.; Berset, C. Antioxidant activity of phenolic compounds in 2,2’-azobis(2-amidinopropane) dihydrochloride (AAPH)-induced oxidation: Synergistic and antagonistic effects. J. Am. Oil Chem. Soc. 2003, 80, 1007–1012. [Google Scholar] [CrossRef]
  70. Vertuani, S.; Angusti, A.; Manfredini, S. The antioxidants and pro-antioxidants network: An overview. Curr. Pharm. Des. 2004, 10, 1677–1694. [Google Scholar] [CrossRef] [Green Version]
  71. Cao, G.; Sofic, E.; Prior, R. Antioxidant and prooxidant behavior of flavonoids: Structure-activity relationships. Free Radic. Biol. Med. 1997, 22, 749–760. [Google Scholar] [CrossRef]
  72. Wu, L. Effect of chlorogenic acid on antioxidant activity of Flos Lonicerae extracts. J. Zhejiang Univ. Sci. B 2007, 8, 673–679. [Google Scholar] [CrossRef] [Green Version]
  73. Olthof, M.R.; Hollman, P.C.H.; Buijsman, M.N.C.P.; van Amelsvoort, J.M.M.; Katan, M.B. Chlorogenic Acid, Quercetin-3-Rutinoside and Black Tea Phenols Are Extensively Metabolized in Humans. J. Nutr. 2003, 133, 1806–1814. [Google Scholar] [CrossRef]
  74. Tajik, N.; Tajik, M.; Mack, I.; Enck, P. The potential effects of chlorogenic acid, the main phenolic components in coffee, on health: A comprehensive review of the literature. Eur. J. Nutr. 2017, 56, 2215–2244. [Google Scholar] [CrossRef]
  75. Wang, J.; Fang, X.; Ge, L.; Cao, F.; Zhao, L.; Wang, Z.; Xiao, W. Antitumor, antioxidant and anti-inflammatory activities of kaempferol and its corresponding glycosides and the enzymatic preparation of kaempferol. PLoS ONE 2018, 13, e0197563. [Google Scholar] [CrossRef]
  76. Mellou, F.; Lazari, D.; Skaltsa, H.; Tselepis, A.D.; Kolisis, F.N.; Stamatis, H. Biocatalytic preparation of acylated derivatives of flavonoid glycosides enhances their antioxidant and antimicrobial activity. J. Biotechnol. 2005, 116, 295–304. [Google Scholar] [CrossRef]
  77. Balouiri, M.; Sadiki, M.; Ibnsouda, S.K. Methods for in vitro evaluating antimicrobial activity: A review. J. Pharm. Anal. 2016, 6, 71–79. [Google Scholar] [CrossRef] [Green Version]
  78. Rautio, M.; Sipponen, A.; Peltola, R.; Lohi, J.; Jokinen, J.J.; Papp, A.; Carlson, P.; Sipponen, P. Antibacterial effects of home-made resin salve from Norway spruce (Picea abies). Apmis 2007, 115, 335–340. [Google Scholar] [CrossRef] [PubMed]
  79. Vainio-Kaila, T.; Kyyhkynen, A.; Rautkari, L.; Siitonen, A. Antibacterial effects of extracts of Pinus sylvestris and Picea abies against Staphylococcus aureus, Enterococcus faecalis, Escherichia coli, and Streptococcus pneumoniae. BioResources 2015, 10, 7763–7771. [Google Scholar] [CrossRef]
  80. Sipponen, A.; Laitinen, K. Antimicrobial properties of natural coniferous rosin in the European Pharmacopoeia challenge test. Apmis 2011, 119, 720–724. [Google Scholar] [CrossRef] [PubMed]
  81. Fyhrquist, P.; Virjamo, V.; Hiltunen, E.; Julkunen-Tiitto, R. Epidihydropinidine, the main piperidine alkaloid compound of Norway spruce (Picea abies) shows promising antibacterial and anti-Candida activity. Fitoterapia 2017, 117, 138–146. [Google Scholar] [CrossRef] [Green Version]
  82. Vainio-Kaila, T.; Zhang, X.; Hänninen, T.; Kyyhkynen, A.; Johansson, L.S.; Willför, S.; Österberg, M.; Siitonen, A.; Rautkari, L. Antibacterial Effects of Wood Structural Components and Extractives from Pinus sylvestris and Picea abies on Methicillin-Resistant Staphylococcus aureus and Escherichia coli O157:H7. BioResources 2017, 12, 7601–7614. [Google Scholar] [CrossRef]
  83. Tanase, C.; Cosarca, S.; Toma, F.; Mare, A.; Cosarca, A.; Man, A.; Miklos, A.; Imre, S. Antibacterial Activities of Spruce Bark (Picea abies L.) Extract and Its Components Against Human Pathogens. Rev. Chim. 2018, 69, 1462–1467. [Google Scholar] [CrossRef]
  84. Haman, N.; Morozova, K.; Tonon, G.; Scampicchio, M.; Ferrentino, G. Antimicrobial Effect of Picea abies Extracts on E. coli Growth. Molecules 2019, 24, 4053. [Google Scholar] [CrossRef] [Green Version]
  85. Semerci, A.B.; İnceçayir, D.; Konca, T.; Tunca, H.; Tunç, K. Phenolic constituents, antioxidant and antimicrobial activities of methanolic extracts of some female cones of gymnosperm plant. IJBB 2020, 57, 298–303. [Google Scholar]
  86. Mitić, Z.S.; Jovanović, B.; Jovanović, S.C.; Mihajilov-Krstev, T.; Stojanović-Radić, Z.Z.; Cvetković, V.J.; Mitrović, T.L.; Marin, P.D.; Zlatković, B.K.; Stojanović, G.S. Comparative study of the essential oils of four Pinus species: Chemical composition, antimicrobial and insect larvicidal activity. Ind. Crop. Prod. 2018, 111, 55–62. [Google Scholar] [CrossRef]
  87. Garzoli, S.; Masci, V.L.; Caradonna, V.; Tiezzi, A.; Giacomello, P.; Ovidi, E. Liquid and Vapor Phase of Four Conifer-Derived Essential Oils: Comparison of Chemical Compositions and Antimicrobial and Antioxidant Properties. Pharmaceuticals 2021, 14, 134. [Google Scholar] [CrossRef] [PubMed]
  88. Ait-Ouazzou, A.; Cherrat, L.; Espina, L.; Lorán, S.; Rota, C.; Pagán, R. The antimicrobial activity of hydrophobic essential oil constituents acting alone or in combined processes of food preservation. IFSET 2011, 12, 320–329. [Google Scholar] [CrossRef]
  89. Trombetta, D.; Castelli, F.; Sarpietro, M.G.; Venuti, V.; Cristani, M.; Daniele, C.; Saija, A.; Mazzanti, G.; Bisignano, G. Mechanisms of antibacterial action of three monoterpenes. Antimicrob. Agents Chemother 2005, 49, 2474–2478. [Google Scholar] [CrossRef] [Green Version]
  90. Borugă, O.; Jianu, C.; Mişcă, C.; Goleţ, I.; Gruia, A.T.; Horhat, F.G. Thymus vulgaris essential oil: Chemical composition and antimicrobial activity. J. Med. Life 2014, 3, 56–60. [Google Scholar]
  91. Burt, S. Essential oils: Their antibacterial properties and potential applications in foods—A review. Int. J. Food Microbiol. 2004, 94, 223–253. [Google Scholar] [CrossRef]
Figure 1. The HPLC-PDA (250–380 nm) chromatogram of Norway spruce (solid line) and eastern hemlock (dashed line) green cone extracts.
Forests 12 01189 g001
Figure 2. Results of the factor analysis for Norway spruce sample; factor loadings Factor 1 vs. Factor 2. Rotation: Varimax normalized; Extraction: principal components. F1 denotes the group of vectors corresponding to Factor 1, and we use F2 and F3 similarly (see Table 3 as well). For the interpretation of the tags, please refer to Table 1.
Forests 12 01189 g002
Figure 3. Results of the factor analysis for eastern hemlock sample; factor loadings Factor 1 vs. Factor 2. Rotation: Varimax normalized; Extraction: principal components. F1 denotes the group of vectors corresponding to Factor 1, and we use F2, F3 and F4 similarly. Please refer to the last column of Table 6. For the interpretation of the tags, please refer to Table 1.
Forests 12 01189 g003
Figure 4. Growth curves of S. aureus with (A) Eastern hemlock green cone, (B) Eastern hemlock mature cone, (C) Norway spruce green cone, (D) Norway spruce mature cone extracts.
Forests 12 01189 g004
Figure 5. Growth curves of E. coli with Norway spruce green cone extracts.
Forests 12 01189 g005
Table 1. Liquid chromatographic/mass spectrometric identification of the major extractives in the cones of Norway spruce (S) and eastern hemlock (H); tr: retention time; [M-H]: parent ion; MS/MS: major fragment ions; n.i.: no ions.
Peaktr
(min)
CompoundTagSH[M-H]
m/z
MS/MS
m/z
115.10Procianidin dimerPBd1xx577425, 407, 289, 245, 125
215.50(+)-Catechin(+)-Catxx289245, 203, 125, 123, 109
316.10Procianidin dimerPBd2xx577425, 407, 289, 245, 125
417.23UnidentifiedUi10 x369255, 207, 179, 135
517.75Procianidin trimerPCt1xx865739, 695, 577, 407, 289, 125
618.38Chlorogenic acid isomerCha1 x353191, 179, 161, 135
719.00Chlorogenic acid isomerCha2 x353191, 179, 161, 135
819.80Procianidin dimerPBd3x 577425, 407, 289, 245, 125
919.80Procianidin trimerPCt2 x865739, 695, 577, 407, 289, 125
1020.20(−)-Epicatechin(−)-Epixx289245, 203, 125, 123, 109
1120.80UnidentifiedUi11 xn.in.i
1222.17UnidentifiedUi1x n.in.i
1324.35UnidentifiedUi12 x335291, 179, 161, 135, 111
1424.70Piceatannol-O-hexosidePtanHexx 405243, 225, 201
1525.50Taxifolin-O-hexosideThxx465447, 437, 303, 285, 259, 217, 179, 125
1628.50UnidentifiedUi2x n.in.i
1729.50UnidentifiedUi3x n.in.i
1830.80PiceatannolPtanx 243225, 201, 175, 174
1930.90UnidentifiedUi13 x567409, 329
2032.70UnidentifiedUi14 x451381, 341, 231, 217, 189
2133.30Quercetin-O-hexosideQhxx463301, 300, 271, 255, 179
2235.30Coumaric acid derivativeCou1x 359341, 311, 297, 282, 195, 163, 145
2335.40Quercetin-O-pentosideQp x433301, 300, 271, 255, 243, 179
2436.00Kaempferol-O-rutinosideKr1 x593447, 285, 284, 255, 227
2536.62Kaempferol-O-hexosideKhxx447285, 284, 255, 227
2637.30Unidentified-O-hexosideUh x431269, 268
2737.80Isorhamnetin-O-hexosideIhx 477315, 314, 300, 299, 271
2838.00Kaempferol-O-pentosideKp1 x417285, 284, 255, 227
2938.60Kaempferol-O-pentosideKp2 x417285, 284, 255, 227
3039.20Kaempferol-O-pentosideKp3 x417285, 284, 255, 227
3141.20Kaempferol-acetyl-hexosideKah x489429, 285, 284, 255, 227
3242.00UnidentifiedUi4x n.in.i.
3344.30UnidentifiedUi5x 351333, 315, 275, 251
3446.00Kaempferol-O-rutinosideKr2 x593447, 285, 284, 255, 227
3551.10Coumaric acid derivativeCou2x 341326, 311, 297, 263, 239, 163, 145, 119
3652.70UnidentifiedUi6x 401333, 315, 257
3753.80Coumaric acid derivativeCou3x 445427, 397, 349, 277, 251, 163, 145, 119
3854.20UnidentifiedUi7x 521473, 195, 179, 165, 150, 119
3954.40Coumaric acid derivativeCou4x 475457, 427, 281, 163, 145, 119
4055.00Coumaric acid derivativeCou5x 505487, 457, 311, 163, 145, 119
4155.90Kaempferol-coumaric acid derivativeKCou1 x739593, 453, 285, 284, 255, 227, 163, 145, 119
4256.00Coumaric acid derivativeCou6x 505491, 477, 341, 327, 177, 163, 145, 119
4356.31Coumaric acid derivativeCou7xx505491, 477, 341, 327, 177, 163, 145, 119
4457.20Ferulic acid derivativeFeax 535520, 491, 341, 207, 193, 179, 163, 149, 134
4560.62Kaempferol-coumaric acid derivativeKCou2 x723577, 559, 437, 285, 284, 255, 227, 163, 145, 119
4661.30UnidentifiedUi15 x249205
4761.60UnidentifiedUi8x 385317, 299, 253
4862.50Coumaric acid derivativeCou8x 667521, 403, 323, 163, 145, 119
4964.14UnidentifiedUi16 x315297
5064.30UnidentifiedUi9x 383315, 299, 269
5168.00UnidentifiedUi17 xn.in.i
5268.81UnidentifiedUi18 xn.in.i
5374.00UnidentifiedUi19 xn.in.i
Table 2. Correlation analysis of the polyphenol peak areas and antioxidant properties of Norway spruce cone extracts. Significant correlations (for p < 0.05, n = 11, ǀRǀ ≥ 0.60) were marked with an asterisk. FRAP: Ferric Reducing Antioxidant Power; TPC: Total Polyphenol Content. For the interpretation of tags please refer to Table 1.
TagFRAPTPC
RScoreRScoreSum
PtanHex0.92 *0.920.91 *0.911.83
Cou10.93 *0.930.79 *0.791.72
Ui20.92 *0.920.75 *0.751.67
Cou20.79 *0.790.85 *0.851.64
Cou40.78 *0.780.84 *0.841.62
Fea0.75 *0.750.86 *0.861.60
Cou70.84 *0.840.76 *0.761.60
Cou30.74 *0.740.85 *0.851.60
Ptan0.90 *0.900.69 *0.691.59
Ui60.73 *0.730.85 *0.851.58
Ui40.84 *0.840.68 *0.681.52
Ui10.84 *0.840.67 *0.671.51
Ih0.81 *0.810.65 *0.651.46
Ui90.66 *0.660.79 *0.791.45
Kh0.82 *0.820.60 *0.601.43
Ui70.64 *0.640.76 *0.761.39
(+)-Cat0.77 *0.770.550.551.31
Cou50.550.550.69 *0.691.23
Qh0.74 *0.740.440.441.18
Th0.70 *0.700.410.411.11
Ui30.64 *0.640.400.401.05
PBd10.61 *0.610.370.370.98
Ui100.430.430.540.540.98
Cou60.340.340.550.550.88
PBd20.520.520.220.220.74
Cou80.220.220.500.500.72
(−)-Epi0.480.480.200.200.68
Ui50.440.440.180.180.62
PCt10.440.440.150.150.59
PBd30.400.400.130.130.53
Table 3. Factor analysis of the polyphenol peak areas and the antioxidant properties of Norway spruce cone extracts. “Factor” indicates the factor that correlates best with the given concentration of a given compound; “Dist.” is the Euclidian distance of a given compound from the FRAP or the TPC vector. FRAP: Ferric Reducing Antioxidant Power; TPC: Total Polyphenol Content. For the interpretation of the tags please refer to Table 1.
TagFRAPTPC Factor
Dist.ScoreDist.ScoreSum
PtanHex0.240.810.120.911.721
Cou70.150.880.290.771.651
Cou40.470.620.280.781.411
Cou20.460.630.300.771.391
Ui60.560.550.270.791.341
Cou10.320.750.600.531.28-
Ui20.340.730.610.531.25-
Cou30.600.510.370.711.221
Ptan0.390.690.700.461.15-
Ui10.450.640.650.501.142
Fea0.680.450.420.671.131
Ui90.700.440.420.671.111
Ui40.470.620.690.461.08-
Ih0.530.570.740.420.99-
Ui70.760.380.540.580.961
Kh0.530.570.830.360.93-
Cou50.860.310.620.510.821
(+)-Cat0.620.500.900.300.802
Qh0.650.470.950.260.742
Th0.750.401.050.190.582
Ui30.760.381.050.190.572
Ui101.000.190.820.360.551
PBd10.830.331.050.190.512
Cou61.110.100.870.320.431
(−)-Epi0.880.291.120.130.412
Ui50.950.241.190.070.313
PBd20.950.231.200.060.302
Cou81.240.000.970.240.241
PCt11.000.191.220.050.242
PBd31.060.141.290.000.142
Table 4. Summary of the chemometric evaluation of the antioxidant efficiency of Norway spruce cone polyphenols. FRAP: Ferric Reducing Antioxidant Power; TPC: Total Polyphenol Content. “Sign” indicates the type (positive/negative) of the significant correlation between compounds’ concentration and FRAP/TPC. Significant correlations (for p < 0.05, n = 11, ǀRǀ ≥ 0.60) were marked with an asterisk. For the interpretation of the tags, please refer to Table 1.
TagFRAPTPC
ScoreSignScoreSignSum
PtanHex1.73 *+1.82 *+3.55
Cou71.71 *+1.53 *+3.25
Cou21.42 *+1.62 *+3.04
Cou41.41 *+1.62 *+3.03
Cou11.68 *+1.32 *+3.00
Ui21.65 *+1.27 *+2.92
Ui61.28 *+1.64 *+2.92
Cou31.25 *+1.56 *+2.82
Ptan1.59 *+1.15 *+2.73
Fea1.20 *+1.53 *+2.73
Ui11.48 *+1.17 *+2.65
Ui41.46 *+1.14 *+2.60
Ui91.09 *+1.46 *+2.56
Ih1.39 *+1.07 *+2.45
Kh1.39 *+0.96 *+2.36
Ui71.02 *+1.33 *+2.35
(+)-Cat1.27 *+0.85 2.12
Cou50.85 1.20 *+2.05
Qh1.21 *+0.71 1.92
Th1.09 *+0.60 1.69
Ui31.03 *+0.59 1.62
Ui100.62 0.91 1.53
PBd10.94 *+0.55 1.49
Cou60.44 0.87 1.31
(−)-Epi0.77 0.32 1.09
PBd20.76 0.29 1.04
Cou80.22 0.75 0.96
Ui50.68 0.25 0.92
PCt10.63 0.20 0.83
PBd30.54 0.13 0.67
Table 5. Correlation analysis of the polyphenol peak areas and antioxidant properties of eastern hemlock cone extracts. Significant correlations (for p < 0.05, n = 11, ǀRǀ ≥ 0.60) were marked with an asterisk. FRAP: Ferric Reducing Antioxidant Power; TPC: Total Polyphenol Content. For the interpretation of the tags please refer to Table 1.
TagFRAPTPC
RScoreRScoreSum
Kr20.88 *0.880.82 *0.821.71
Ui140.88 *0.880.74 *0.741.61
Kp20.83 *0.830.62 *0.621.45
Kah0.79 *0.790.65 *0.651.44
Kr10.76 *0.760.600.601.36
PCt20.78 *0.780.570.571.36
KCou10.490.490.78 *0.781.27
Cou70.76 *0.760.510.511.27
Kh0.75 *0.750.510.511.26
Kp10.73 *0.730.530.531.26
Kp30.75 *0.750.490.491.24
PBd1−0.480.48−0.75 *0.751.22
Cha20.63 *0.630.530.531.17
KCou20.410.410.74 *0.741.16
Qp0.71 *0.710.340.341.05
Qh0.66 *0.660.250.250.90
Uh0.62 *0.620.200.200.82
PBd2−0.210.21−0.590.600.81
Ui19−0.390.39−0.410.410.80
PCt1−0.210.21−0.580.580.79
(+)-Cat−0.060.06−0.510.510.56
Ui170.320.320.190.190.51
(−)-Epi0.310.31−0.170.170.47
Ui100.060.06−0.410.410.47
Ui110.250.25−0.210.210.46
Cha10.290.29−0.170.170.45
Ui130.320.32−0.120.120.45
Ui18−0.340.34−0.100.100.44
Ui150.220.220.210.210.43
Ui16−0.330.330.090.090.42
Ui120.190.19−0.210.210.40
Th0.280.28−0.120.120.40
Table 6. Factor analysis of the polyphenol peak areas and the antioxidant properties of eastern hemlock cone extracts. “Factor” indicates the factor that correlates best with the given concentration of a given compound; “Dist.” is the Euclidian distance of a given compound from the FRAP or the TPC vector. FRAP: Ferric Reducing Antioxidant Power; TPC: Total Polyphenol Content. For the interpretation of the tags, please refer to Table 1.
TagFRAPTPC Factor
Dist.ScoreDist.ScoreSum
Kr20.100.940.460.751.681
Ui140.210.870.560.691.561
Kah0.270.830.680.631.461
Kp20.390.760.800.561.321
Kh0.440.730.890.511.241
Kr10.520.680.830.541.221
PCt20.520.680.840.541.221
Kp10.510.680.860.521.211
Kp30.530.670.920.491.171
Cou70.600.630.950.481.111
KCou10.950.420.580.681.10−2
Cha20.690.580.900.511.083
Qp0.650.601.050.421.021
KCou21.030.370.670.631.00−2
Qh0.770.531.180.350.881
Uh0.780.521.210.340.85-
Ui170.930.421.120.380.814
Ui151.100.321.160.360.684
Ui131.100.321.460.200.522
Th1.140.301.470.190.492
Cha11.140.301.500.170.472
(−)-Epi1.160.281.520.170.452
Ui121.170.281.520.160.442
Ui111.200.261.530.160.422
Ui161.580.021.300.280.31−2
Ui101.320.181.650.090.282
Ui181.580.021.430.220.24−3
(+)-Cat1.430.121.720.050.172
Ui191.620.001.600.120.12-
PCt11.500.071.750.040.112
PBd21.510.071.760.030.102
PBd11.620.001.820.000.002
Table 7. Summary of the chemometric evaluation of the antioxidant efficiency of eastern hemlock cone polyphenols. FRAP: Ferric Reducing Antioxidant Power; TPC: Total Polyphenol Content. “Sign” indicates the type (positive/negative) of the significant correlation between compound concentrations and FRAP/TPC. Significant correlations (for p < 0.05, n = 11, ǀRǀ ≥ 0.60) were marked with an asterisk. For the interpretation of the tags please refer to Table 1.
TagFRAPTPC
ScoreSignScoreSignSum
Kr21.82 *+1.57 *+3.39
Ui141.75 *+1.43 *+3.17
Kah1.62 *+1.28 *+2.90
Kp21.59 *+1.17 *+2.77
Kr11.44 *+1.14 2.59
PCt21.46 *+1.11 2.57
Kh1.48 *+1.02 2.50
Kp11.41 *+1.05 2.47
Kp31.42 *+0.98 2.40
Cou71.38 *+0.99 2.37
KCou10.90 1.46 *+2.37
Cha21.21 *+1.04 2.25
KCou20.78 1.37 *+2.16
Qp1.31 *+0.76 2.07
Qh1.18 *+0.60 1.78
Uh1.14 *+0.53 1.68
Ui170.75 0.58 1.32
PBd10.48 0.75-1.22
Ui150.54 0.58 1.11
Ui130.64 0.32 0.96
Cha10.59 0.34 0.93
Ui190.39 0.53 0.92
(−)-Epi0.59 0.33 0.92
PBd20.28 0.63 0.91
PCt10.28 0.61 0.90
Th0.58 0.31 0.89
Ui110.51 0.36 0.87
Ui120.46 0.38 0.84
Ui100.25 0.50 0.75
(+)-Cat0.18 0.56 0.74
Ui160.35 0.38 0.73
Ui180.36 0.31 0.68
Table 8. Antibacterial activity of cone extracts (1 mg/mL in 1% DMSO) by disc diffusion test.
Bacterial StrainPositive ControlEHGCEHMCNSGCNSMC
S. aureus++++++++
E. coli++++----
++++ Strong activity (zone of inhibition > 15 mm); + Very weak activity (zone of inhibition around 1 mm); - No activity.
Table 9. IC50 values of cone extracts (1 mg/mL in 1% DMSO).
Bacterial Strain IC50 (mg/mL)
EHGCEHMCNSGCNSMC
S. aureus0.500.50-0.25
E. coli----
Table 10. MIC values of cone extracts (1 mg/mL in 1% DMSO) determined from growth curves.
Bacterial Strain MIC (mg/mL)
EHGCEHMCNSGCNSMC
S. aureus0.1250.0041.0000.008
E. coli----
Publisher’s Note: MDPI stays neutral with regard to jurisdictional claims in published maps and institutional affiliations.

